Introduction to Demand Signal Repository
Introduction
Oracle Demand Signal Repository (DSR) helps manufacturers collect detailed retailer Point of Sale and other demand data, analyze it to identify issues and opportunities, and respond using a Services Oriented Architecture (SOA)-enabled services library.
Oracle Demand Signal Repository supports most typical retail data sources at the day and SKU level of detail, including:
-
Daily point-of-sale
-
On-hand inventory at the store and retail distribution center
-
Store orders and receipts
-
Replenishment rules
-
Retail distribution center withdrawals
-
Returns
-
Store promotions
-
Sales forecasts
Demand Signal Repository transforms retailer data into manufacturer terms, including manufacturer item identification, manufacturer hierarchies, and calendars– so that direct retail data can be analyzed and reported on in either the manufacturer’s terms or the terms of each individual retailer. . A high-performance data loading facility cleanses the data and allocates it to a uniform set of dimension levels.
The Demand Signal Repository data model is based on the Oracle Data Warehouse for Retail (ODWR) data model, adapted to a manufacturer point of view. Pre-built reporting and dashboard templates support category management and trading partner score carding. Users can develop additional reports that combine data in customer-specific ways.
Demand Signal Repository provides the ability to share the external data with complementary applications with both Oracle applications such as Demantra Demand Management and non-Oracle applications. Demand Signal Repository offers direct, pre-built integration into Demantra as well as web services allow for data sharing with non-Demantra applications. These web services provide cleansed retail point of sale, on-hand inventory and other data at daily store level, or aggregated to a higher level as needed.
Business Intelligence Dashboard
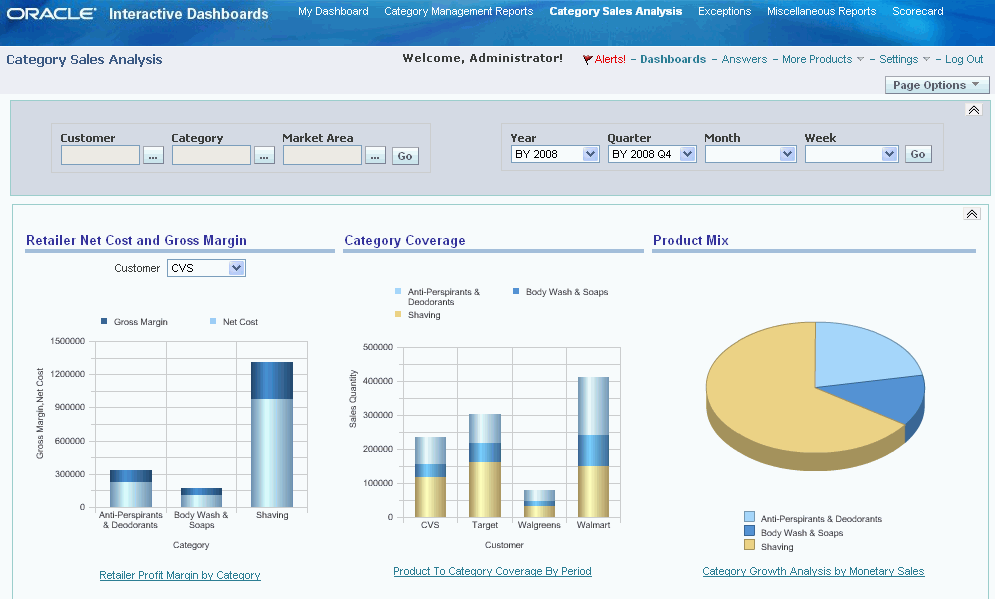
When users log in, the Demand Signal Repository creates a seeded dashboard with the appropriate content and dimension levels based on their user roles. These dashboards can be further customized to display the data in which users are most interested.
Role-specific dashboards exist for:
-
Account Team (Sales Manager, Customer Service Representative)
-
Category Manager (Category Analyst, Marketing Manager, Executive Management)
-
Supply Chain (Logistics Personnel, Demand Planner, S&OP Planner)
Each dashboard consists of related pages, which are organized using tabs. Each page corresponds to a single functional area (for example, category management, score carding, and so on). From within the dashboard you can report on any of the measures that apply.
Data
Demand Signal Repository works with demand data from many different sources. For example, the Demand Signal Repository collects direct retail data from multiple retailers as well as syndicated providers (where feasible). In addition, if a retailer provides competitor data to help support advanced category management processes, the Demand Signal Repository can be used by a manufacturer to capture and analyze competitor data as well as the manufacturer’s own data.
Because data comes from a variety of sources (collectively called fact data), Demand Signal Repository must be validated and aggregated to an appropriate level. Market item data may apply to an entire market, rather than a specific retailer. It may also be expressed in terms of a brand, category or other higher-level item dimension nodes, at a different periodicity and an aggregated time period.
Oracle’s Demand Signal Repository captures and manages the following retail fact data at the following levels of detail:
| Data Type | Organization Level | Item Level | Time |
| Retail sales (POS) | Business Unit (store or DC) | SKU | Day (total) |
| Ordered quantity/amount | Business Unit (store or DC) | SKU | Day (total) |
| Backordered quantity/amount | Business Unit (store or DC) | SKU | Day (ending balance) |
| On-hand inventory | Inventory Location (e.g. back of store, shelf, display) within a Business Unit (store or DC) | SKU | Day (ending balance) |
| In-transit (inbound) inventory by expected arrival date | Business Unit (store or DC) | SKU | Day (ending balance) |
| Shipped quantity/amount | Business Unit (DC) | SKU | Day (total) |
| Received quantity/amount | Business Unit (store or DC) | SKU | Day (total) |
| Quality hold quantity/amount | Inventory Location (e.g. back of store, shelf, display) within a Business Unit (store or DC) | SKU | Day (ending balance) |
| Returned quantity/amount | Business Unit (store or DC) | SKU | Day (total) |
| Retail promotions | Business Unit (store or DC) | SKU | Day |
| Sales forecast | Business Unit (store or DC) | SKU | Day (total) |
Measures
Measures are objective performance criteria that provide detailed insight into the demand situation of an organization. You can use the Demand Signal Repository’s base measure values can be used to calculate common performance measures such as sales growth, gross margin, and inventory cover (days of supply), at the appropriate hierarchy levels. DSR Measures are organized into different categories for reporting and ease-of-use. You can use DSR's reporting capabilities to filter measures by category.
Some common measures cannot be calculated from the base data in the Demand Signal Repository data model, and are provided directly by the retailer or from some other external party in precalculated form. For these “external measures,” Demand Signal Repository provides a data loading facility and database tables to store the values at the hierarchy levels at which they were received.
The following table outlines the measures that are available in Demand Signal Repository:
| Measure | Category | Description | Unit of Measure |
| Monetary Sales Growth | Sales Growth | Percentage growth of monetary sales compared to prior period. | % |
| Unit Sales Growth | Sales Growth | Percentage growth of unit sales compared to prior period. | % |
| Alt UOM Sales Growth | Sales Growth | Percentage growth of alternative UOM sales compared to prior period. | % |
| % Product to Category Coverage by Value | Market Share | The sales of a single product as a percentage of total category sales - by $ value. | % |
| % Product to Category Coverage by Volume | Market Share | The sales of a single product as a percentage of total category sales - by unit volume. | % |
| Market ACV by $ value | Market Share | Total sales of all products across all categories in a specific market area. Provided by a syndicated data provider like AC Nielsen or IRI. | Currency |
| Market ACV by unit volume | Market Share | Total sales of all products across all categories in a specific market area. Provided by a syndicated data provider like AC Nielsen or IRI. | EA |
| % Category to Market Coverage by Value | Market Share | The sales of a single category as a percentage of total market sales - by $ sales. ACV provided by syndicated provider like Nielsen or IRI. | % |
| % Category to Market Coverage by Volume | Market Share | The sales of a single category as a percentage of total market sales - by unit volume. ACV provided by syndicated provider like Nielsen or IRI. | % |
| Market Share (percentage of subcategory, category, department) | Market Share | One supplier's products sales as a percentage of total category sales. | % |
| Share of Market (percentage of geographical market) | Market Share | The retailer's sales as a percentage of total market sales. | % |
| Shopper Penetration | Market Share | The percentage of shoppers who purchased items in the scope of the measure. | % |
| Retailer Gross Margin | Gross Margin $ | Difference between the retailer's cost and the total sales price of items. | Currency |
| Retailer Gross Margin Increase | Gross Margin $ | Difference between profit in current period and profit in prior period. | Currency |
| Retailer Gross Margin % | Gross Margin % | Percentage difference between the retailer's cost and the average selling price of items. | % |
| Retailer Gross Margin Point Increase | Gross Margin % | The difference between the current gross margin percentage and the prior period gross margin percentage. | |
| GMROII (or GMROI) | Gross Margin % | Gross Margin Return on Inventory Investment: The retailer's return on inventory expenditures. | |
| % Contribution Sales Value to Category | Category Contribution | The sales of a single product as a percentage of total category sales - by $ value. | % |
| % Contribution Profit to Category | Category Contribution | The retail profit of a selected item as a percentage of total category retail profit. | % |
| Average Price | Per Unit Performance | Point of sale receipts divided by unit volume sold. | Currency |
| Unit Profit | Per Unit Performance | Monetary difference between the retailer's cost and the average selling price of items. | Currency |
| Total Category Average Sales Value | Category Average Performance | Average per product sales amount for a specific product category - by $ value. | Currency |
| Total Category Average Sales Volume | Category Average Performance | Average per product sales amount for a specific product category - by unit volume. | EA |
| Invoice Accuracy % | Invoice Accuracy | Percentage deviation of invoice amount from agreed price and received quantity, or percentage of invoices that fell within tolerance established. | % |
| Payment days | Timely Payment | Average number of days from invoice to payment. | Days |
| Late payment | Timely Payment | Average number of days payments were late. | Days |
| Number of Deductions | Deductions | Count of deductions taken. | |
| Deduction Amount | Deductions | Monetary amount of deductions taken. | Currency |
| Deduction Balance | Deductions | Monetary balance of outstanding deductions. | Currency |
| Item Data Accuracy % | Data Accuracy | Accuracy of the product data provided by supplier through the GDSN. | % |
| Item Data Synchronization % | Data Synch | The percentage of items that are synchronized via the Global Data Synchronization Network (GDSN). | % |
| Sales Forecast Error | Forecasting | The percentage error of the POS forecast vs actual sales for the period. | % |
| Sales Forecast Accuracy | Forecasting | The percentage accuracy of the POS forecast vs actual sales for the period. | % |
| Order Change % | Order Changes & Accuracy | % of orders or line items that had to be revised prior to shipment. | % |
| Perfect Order % | Inventory | The number of orders with no error, filled correctly for every line, on time and invoiced correctly divided by the total number of orders. | % |
| Inventory turns (annual) | Inventory | The value of annual shipments at cost (for the most recent period) divided by the total average daily inventory value at cost. | |
| Max Inventory cover | Inventory | Number of days of historical or forecast inventory consumption represented by quantity on-hand. | Days |
| Min Inventory cover | Inventory | Number of days of historical or forecast inventory consumption represented by quantity on-hand. | Days |
| Promotional Sell-Thru | Promotions | Percentage of promotional order that sold through during the promotional period. | % |
| Order Cycle Time | Order Cycle Time | The average number of days from when a PO is written until it is received. | Days |
| On-time Delivery (appointment date) | On-Time Delivery | Percentage of shipments delivered by appointment date. | % |
| On-time Delivery (appointment time) | On-Time Delivery | Percentage of shipments that were delivered within the appointment window on the appointment date. | % |
| Service Level / Fill Rate | Service Level | Amount ordered vs amount shipped. | % |
| % of Stores Scanning | Stocking | Percentage of store locations that sold a particular item. | % |
| % Not Scanning | Stocking | Percentage of store locations that did not sell a particular item. | % |
| In-stock % | Stocking | Percentage of stocking locations that had stock available when sampled. | % |
| Understock % | Stocking | Percentage of stocking locations that were below their minimum expected stock level when sampled. | % |
| Lost Sales | Stocking | Estimated value of sales lost due to out-of-stock conditions. | Currency |
| % Returns | Stocking | The percentage of product that the retailer deems unsaleable, as a percentage of cost or units sold . | % |
| Monetary Sales | Sales | Point of sale receipts. | Currency |
| Monetary sales transaction | Sales | ||
| Unit Sales | Sales | Unit volume sold to consumers. | EA |
| UOM Sales | Sales | Unit of Measure | |
| Unit POS Forecast | Forecasting | Forecasted demand at point of sale in unit terms. | EA |
| Unit POS Forecast(Alt) | Forecasting | ||
| Monetary POS Forecast | Forecasting | Forecasted demand at point of sale in monetary terms. | Currency |
| Monetary POS Forecast transaction | Forecasting | ||
| On-hand Inventory | On-Hand | Ending balance of inventory at the storage location (units). | EA |
| On-hand Inventory(Alt) | On-Hand | ||
| On-hand Inventory (retail basis) | On-Hand | Ending balance of inventory at the storage location (on a retail value basis). | Currency |
| On-hand Inventory (cost basis) | On-Hand | Ending balance of inventory at the storage location (on a cost basis). | Currency |
| Ordered Quantity | Orders | Quantity of items ordered (by expected receipt date). | EA |
| Ordered Quantity(Alt) | Orders | ||
| Ordered Value | Orders | Value of items ordered (by expected receipt date). | Currency |
| Ordered Value (Txn) | Orders | ||
| Shipped Quantity | Shipments | Quantity of items shipped (units). | EA |
| Shipped Quantity(Alt) | Shipments | ||
| Shipped Value | Shipments | Value of items shipped (on a cost basis). | Currency |
| Shipped Value (Txn) | Shipments | ||
| In-Transit Quantity | In-Transit | Quantity of items currently in-transit. | EA |
| In_Transit Quantity(Alt) | In-Transit | ||
| Received Quantity | Receipts | Quantity of items received (units). | EA |
| Received Quantity(Alt) | Receipts | ||
| Received Value | Receipts | Value of items received (on a cost basis). | Currency |
| Received Value (Txn) | Receipts | ||
| Returned Quantity | Returns | Quantity of items returned (units). | EA |
| Returned Quantity(Alt) | Returns | ||
| Returned Value | Returns | Value of items returned (on a cost basis). | Currency |
| Returned Value (Txn) | Returns |
Exception Measures
Exception measures count the number and value of exceptions from any of DSR's stored measures, which helps users to quickly identify problems from large amounts of data, and track the quantity and value of these exceptions. Each measure has a corresponding OBIEE iBot that updates the measure at user-defined intervals. Each seeded exception type in DSR has its own exception iBot. For example, an OBIEE iBot tracks exceptions for all Overstock measures.
The following table outlines the exception measures that are available in Demand Signal Repository:
| Measure | Source | Loaded or Calculated Levels | Definition |
| Exception Count | Loaded | Type: Exception Time: Day Business Unit: Store Manufacturer Item: SKU |
The total number of current exceptions. This measure increases by 1 for each daily occurrence of the exception. |
| Exception Quantity | Loaded | Type: Exception Time: Day Business Unit: Store Manufacturer Item: SKU |
The number of DSR measures for which their is an exception. An exception is logged for each daily occurrence. |
| Exception Monetary Value | Loaded | Type: Exception Time: Day Business Unit: Store Manufacturer Item: SKU |
The total monetary value (in $ dollars) of all exceptions. This value is calculated daily. |
Note: Exceptions are only calculated for previous time periods (either day or week). When the exception iBot runs, it does not calculate exceptions based on transactions with the current date. Similarly, iBots calculate weekly exceptions for the prior week, but do not calculate weekly exceptions for the current week. Weekly exceptions are dated as of the day at the end of the week for which the exception is calculated.
Forecast Accuracy is a weekly exception, and its exception iBot only needs to run once a week.
ACV Measures
Many Consumer Goods Manufacturers purchase consumption data from syndicated data sources such as AC Nielsen to analyze market penetration by retailer, geography, product and time. The set of syndicated consumption data includes pre-calculated ACV Measures as well as other measures such as sales by promotion type, baseline sales, and coupon sales. Syndicated consumption data can be purchased at various levels of the product hierarchy and customer organization hierarchy, as well as geographic region or sub-region.
These ACV measures can be loaded into Demand Signal Repository and associated to the appropriate dimensions. For more information, see Loading Syndicated Consumption Measures.
Goals and Thresholds
Demand Signal Repository provides the ability to load goals and thresholds at various levels of the organization and item hierarchy for a given time period (i.e., year, quarter, week, etc.) The main purpose of goals and thresholds are to determine whether performance targets are being met.
Reports and Scorecards
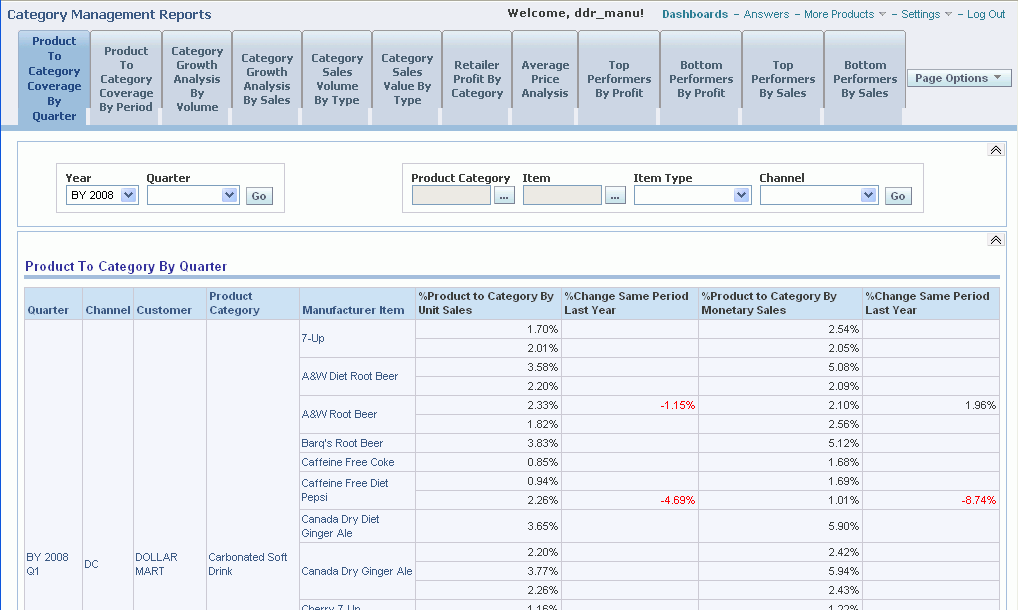
Each dashboard includes pre-made reports for measures contained in that dashboard. These reports display data in multiple formats, including pivot tables and graphs. Users can drill down within reports to the level of detail in which they are interested.
In addition to the pre-made reports, users are also able to create new custom reports about the measures in which they are interested.
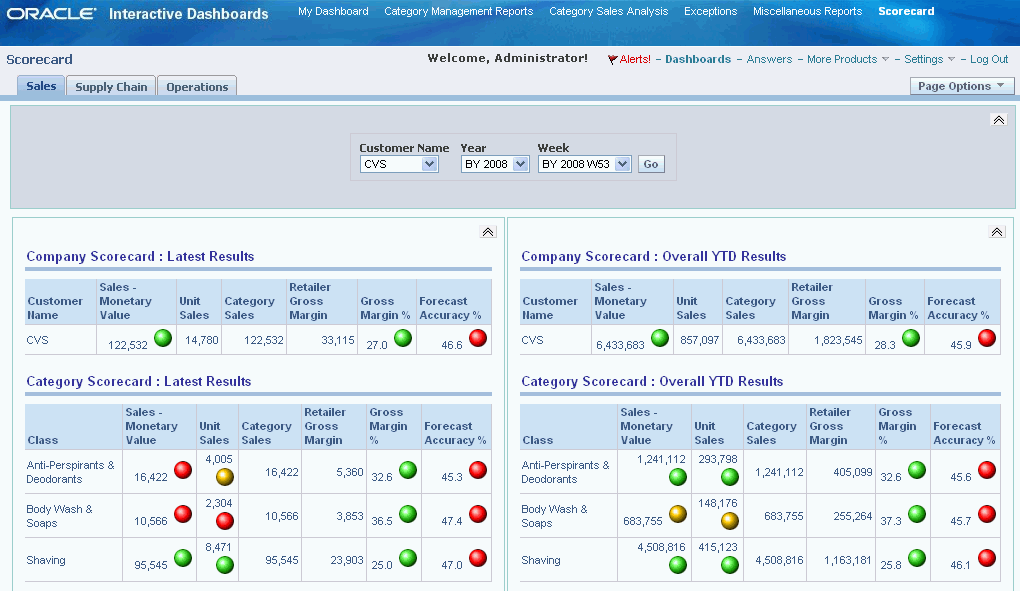
Scorecards use colors to indicate whether or not measures are in bounds or require attention. Scorecards allow users to monitor results over time and to manage by exception. You can customize the green, yellow, and red thresholds and drill down to view the supporting data.
Multiple Hierarchies
Demand Signal Repository represents data using both each individual retailer’s and manufacturers’ item and organizational hierarchies. For example, data received from a retailer is rolled up in terms of that retailer’s hierarchies, and data from all retailers is rolled up in terms of the manufacturer’s hierarchies.
Demand Signal Repository provides other dimension constructs that are available in both the retailer and manufacturer item hierarchies. Retailer and manufacturer SKUs can be organized by style, color, and size. You can also define customized item classification dimensions.
By default, retailer data is delivered at the SKU level. If data is provided at a higher retailer organizational level, it is allocated to the lowest (business unit) level.
Manufacturer Product Hierarchy
At the lowest level, the manufacturer’s item hierarchy consists of manufacturer SKUs. All fact data pertaining to items is stored at the SKU level. Units that share a SKU can be considered to be identical. Above the SKU is the item. Items collect all of the variations of a single logical product together into one entity. For example, apple juice is an item that may have many packaging variations—six-pack, twelve-pack and sizes—500-ml, 12-oz, and so on. All SKUs within an item share the same brand.
Manufacturer items are grouped into subclasses and within a group in a company division.
Retailer Product Hierarchy
Every retailer in Demand Signal Repository has its own item hierarchy. The retailer’s hierarchy begins with the retailer SKU, which has a many-to-one association with a manufacturer SKU, which is linked via the Global Item ID. Like the manufacturer hierarchy, the retailer item hierarchy collects SKUs into items; this level is important to fashion retailers but is often not used by grocery retailers (resulting in one item per SKU). Retailer items are rolled into subclasses (such as organic fruit spreads) and then into categories (such as jam and jelly) and then into departments (such as grocery).
Retailer Organization Hierarchy
All data except on-hand inventory data is stored at the business unit level, which corresponds to an individual store or retailer distribution center. Inventory may be captured at multiple inventory locations within a store or distribution center, which can be aggregated to the business unit level.
Business units in Demand Signal Repository have a single address, so each business unit can be viewed in terms of the logical business organization of a particular retailer (such as Atlantic sales region) or in geographical terms (such as the city, state or country in which that store appears). These dimensions can be used in combination to further refine the selection of business units for reporting or analytical purposes.
Retailer stores and distribution centers are organized into districts, regions, and areas. At the top level of the organization is the chain, which could be a banner. Chains can be amalgamated into retail groups that own multiple banners. The Demand Signal Repository also allows customers to organize each retailer’s business units by channel, market area, trade area, or all three, as well as by specified demographic features.
Geography Hierarchy
Geography can be used to classify retail locations across multiple retailers. In addition to the political geography of city, state, and region, manufacturers can organize locations by their own sales regions and subregions, or by the regional scheme provided by a third party.
Clusters
Demand Signal Repository allows you to group like items and stores into organizational units called Clusters. By grouping customers, stores and items, users are able to execute strategies related to specific demographics, store formats, consumer demographics, weather zones, or other characteristics. Clusters are only logical groupings, and items/stores may belong to more than one cluster at a time. For example, For all stores located along the coast may be assigned to a store cluster called “coastal”. Sales of sunscreen are analyzed by cluster, which compare sales at coastal stores to overall sunscreen sales. Some of stores that belong to the “coastal” store cluster may also belong other store clusters. For example, some of the stores may also be associated with a store cluster called “upscale urban” which describes the consumer demographics of the surrounding area.
Retail, Item and Store cluster definitions are loaded into DSR using the existing reference data load process. For more information, see "Data Loading Interface Tables" for more information.
Retail Clusters
Retail clusters are the grouping of similar retailers at the organization level. For example, you may create retail clusters named Department Store, Drug Store, and so on.
Store Clusters
Consumer goods manufacturers commonly cluster stores with similar properties together to execute strategies related to specific demographics, store formats, consumer demographics, weather zones, or other characteristics. Demand Signal Repository allows users to group business units (either stores or distribution centers) into smaller, more manageable clusters.
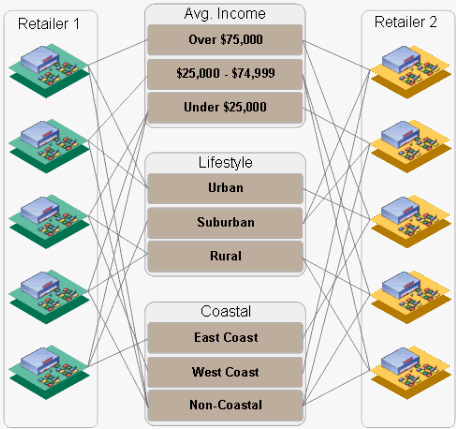
The example below illustrates how stores from different retailers can be assigned to store clusters based on average income, lifestyle and geographic location. A store cluster report is available to analyze sales by store cluster type (for example, Average income, Lifestyle, Coastal) to see breakdown of sales by each unique cluster.
Item Clusters
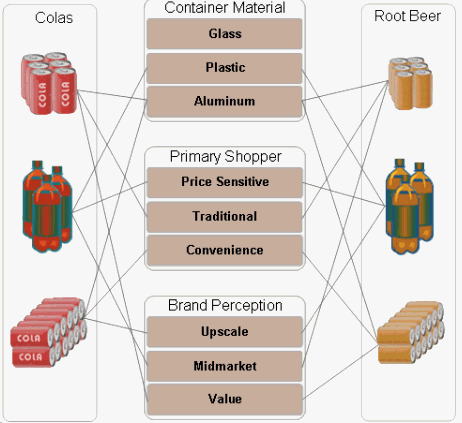
Consumer goods manufacturers commonly cluster similar items together to evaluate sales strategies and promotional activities. Demand Signal Repository has the ability to group items into item clusters at the item subclass (or higher) level in the item dimension. These item clusters are available at the SKU level.
In the example below, SKUs from different product categories are assigned to item clusters based on average container material, primary shopper and brand perception:
Calendars
Demand Signal Repository stores all data is stored in Demand Signal Repository at the day level. All calendar dimensions use days as the lowest level of detail, so Demand Signal Repository data can be represented in terms of any calendar view. Data that is received in weekly buckets must be allocated to the day level in order to be represented in terms of the alternative calendars.
Demand Signal Repository users must be able to review each retailer’s data in terms of the associated retailer’s business calendar. They also must be able to roll it up according to the Gregorian calendar and the manufacturer’s business, fiscal, advertising, and planning calendars. Demand Signal Repository supports the calendars typically used in an organization: Gregorian, business, fiscal, planning, and advertising.
Gregorian Calendar
This calendar is common to all organizations and is pre-seeded in the system. Calendar days are divided into standard calendar months (January, February, and so on) according to the Gregorian system. Calendar months are then rolled up into calendar years. Separately, calendar days are associated with calendar weeks, which do not fall precisely into calendar month boundaries. During configuration, the customer selects which day, typically Sunday or Monday, will begin their calendar week.
Business Calendar
The business calendar rolls up daily activity into business weeks, which are the most common way to review retail data.
Each retailer in Demand Signal Repository—along with the manufacturer—has its own business calendar that reflects differences among organizational practices. Some retailers align their business week to a calendar week (for example, Sunday to Saturday); others start the business week at other times (for example, Thursday) so that peak shopping activity through the weekend falls in the same week.
Business weeks are rolled up into business months. Because business months must align with business week boundaries, they have different numbers of days than calendar months: either 28 (four weeks) or 35 (five weeks). In turn, business months roll up to business quarters, which are usually closely aligned with the company’s fiscal quarters. Each quarter contains two months, each with four weeks, and one month with five weeks, to yield a uniform 13-week (4 + 4 + 5 weeks) quarters. Finally, business quarters roll up into business years, which may begin at a different time of year than the Gregorian year.
The typical business year of four 13-week quarters is 364 days. Every five years or so, a business year must be extended to 53 weeks so that business months continue to approximate Gregorian months. The week is added to one of the four-week months, resulting in a 14-week quarter.
Fiscal Calendar
The fiscal calendar, which is intended for financial reporting, is exclusive to the manufacturer. Usually, calendar days roll into calendar months much as in the Gregorian calendar, but fiscal quarters and years may not align with the Gregorian year.
Planning and Advertising Calendars
Planning and advertising calendars, which provide additional review flexibility, are also exclusive to the manufacturer.
The planning calendar reflects the need to roll up data into demand planning time buckets, which may align with production schedules (for example, a Monday–Sunday production week versus a Sunday–Saturday calendar week). The advertising (ad) calendar, meanwhile, aligns with ad (advertising) weeks.
Both the planning and ad calendars have the same structure. Weeks are collected into periods, which may or may not approximate months. For example, some manufacturers prefer a regular pattern of 13 four-week planning calendar periods. Periods can then be rolled into quarters and years.
Data Allocation and Aggregation
When point-of-sale and sales forecast data is imported to Demand Signal Repository, it may be received in an aggregate time or organizational dimension (for example, weekly, chain-level data). Before the Demand Signal Repository can use this data, it must be allocated to a daily, business-unit level (either store or distribution center values). Allocation to a uniform level allows Demand Signal Repository to aggregate the data according to alternate hierarchies and calendars. Customers can provide a profile that gives the proportions of the aggregate values to be allocated to each component time bucket or location. In the absence of a profile, each value will be the total divided by the number of component data values.
While allocation is a common technique in planning applications, some manufacturers want to prevent the allocation of historical data because it can provide the illusion of detailed data that is an estimate, not an actual value. If a manufacturer collects data from a particular retailer at the chain level, users have the option of mapping the data of the entire chain to a single business unit node, as if it were a store; thereby avoiding allocation in the geographic dimension. Similarly, if all data is weekly, the customer could define a time-based allocation profile that maps all weekly data to a single day of the week.
Alternate Units of Measure
Demand Signal Repository provides an alternate unit of measure that customers can use for aggregation, analysis, and reporting. Data values are stored in terms of both the primary unit and the alternate unit.
The primary unit for measure for all items is assumed to be uniform (typically, each). If primary units of measure differ among items, you should not aggregate items together in their different primary units of measure.
The alternate unit of measure provides a uniform basis of comparison across diverse pack sizes or product categories. For example, a beverage company might select volume in liters as their alternate unit of measure. A company that sells flour might use weight (pounds); some companies use an expected number of consumer uses per package. Each SKU has a ratio to convert the primary unit of measure quantity to the alternate unit of measure quantity.
Currencies
Demand Signal Repository supports two types of currency: reporting currency and transaction currency.
Reporting currency is user-defined and is used for the conversion, aggregation, and viewing of data. You can also view source data in its original transaction currency. Data is stored in both the transactional and reporting currencies for every measure that is a monetary value. By default, the dashboards will use the reporting currency, and you can customize the dashboards to replace the reporting currency measures with the transaction currency.