Exceptions
Exceptions Overview
Demand Signal Repository contains large amounts of detailed data from retailer Point of Sale systems. This data is volumous, and finding specific problems can be time consuming. Exceptions give users a way to automatically sift through the detailed data to get to the most important issues that require further attention. These can either be positive cases, such as sales exceeding forecast by specified levels, or negative cases, such as inventory stockouts over extended periods of time.
Exceptions are generated using OBIEE iBots, which monitor the DSR repository for exceptions and uploads them periodically (for example, daily) to DSR.
Demand Signal Repository includes an Exception Management dashboard to provide exception-based alerting to monitor key store and regional distribution level supply chain KPIs related to promotions and new product introductions (NPIs). As well, exception measures can be used in Exceptions reports to report on potential issues where measures do not meet expectations.
Daily Versus Weekly Exceptions
With the exception of Forecast Accuracy (which is calculated weekly), all DSR exceptions are calculated daily. For daily exceptions, DSR creates one exception for each day that the exception occurs. The iBot only calculates an exception for prior periods, either day or week and ignores exceptions based on transactions with the current date. Similarly, the iBot calculates weekly exceptions for the prior week but does not calculated weekly exceptions for the current week. Note that weekly exceptions are dated as of the day at the end of the week for which the exception is calculated.
Exception Criteria
The following table explains each of the DSR exception types, along with how they are calculated:
| Exception Type | Criteria for Exception Count | Exception Quantity | Exception Monetary Value |
| Out of Stock | On Hand < or = 0 for the Business Unit and Authorized Business Unit = Yes
Note: On Hand = null is not included in the exception count |
Sales Forecast(Q) – Sales(Q)
Note: If Sales Forecast(Q) is <null>, then result = <null>. If Sales(Q) is <null>, then Sales(Q)=0. |
Sales Forecast($) – Sales($)
Note: If Sales Forecast($) is <null> then result = <null>. If Sales($) is <null>, then Sales($)=0. |
| Out of Stock (Imputed) | Actual Sales < Minimum Threshold Sales
Note: This calculation compares the actual sales with the minimum threshold sales. If the actual sales is far below the minimum threshold, then DSR infers that there is an out of stock. Expected sales is either Forecast Sales (Q) if not null, or else calculated based on prior sales. |
Expected Sales(Q) - Sales(Q) | Expected Sales(Q) * (Average Selling Price) - Sales($) |
| Sales Forecast Accuracy | Weekly Sales Forecast Accuracy Threshold was loaded and Sales Forecast Accuracy % is less than Sales Forecast Accuracy Threshold or Weekly Sales Forecast Accuracy Threshold was not loaded, but a Weekly Sales Forecast Accuracy Goal was loaded and Sales Forecast Accuracy % is less than Sales Forecast Accuracy Goal. Note: NOTE: If no Sales Forecast Accuracy Goal or Threshold was loaded then no exception is generated. If Sales Forecast(Q) or Sales (Q) is null then no exception is generated. |
ABSOLUTE ( ( Sales Forecast(Q) for the week - Sales (Q) for the week)) | ABSOLUTE ( ( Sales Forecast($) for the week - Sales ($) for the week ) ) |
| Reorder Point | On Hand + BackOrder(Q) < Reorder Threshold
Note: If both On Hand and BackOrder(Q) are null, then do not create the exception. If Reorder Threshold is <null> then do not create an exception. |
Reorder Threshold - On Hand - BackOrder(Q) | (Reorder Threshold - On Hand - BackOrder(Q) ) * Average Selling Price |
| In-flight Promotional Lift | Sales(Q) < 110 % * (Daily Average of the Sales(Q) for the last four full Manufacturing Business Calendar weeks) For example, if the average daily is being calculated for a Wednesday and the business calendar week runs from Sunday to Saturday, The average would include the four full business weeks concluding on the Saturday prior to the Wednesday’s date. |
- (Sales(Q)- 110 %* (Daily Average of the Sales(Q) for the last four full Manufacturing Business Calendar weeks)) | - ( Sales(Q)- 110 %* (Daily Average of the Sales(Q) for the last four full Manufacturing Business Calendar weeks) )* Average Selling Price |
| New Item Not Selling | If Today’s Date - Available for Sale Date< 30 and [Authorized Location] = Yes and no sales before or during yesterday | Sales Forecast(Q)
Note: If <null> then result = <null> |
Sales Forecast($)
Note: If <null> then result = <null> |
| Promotional Price Deviation | ABSOLUTE {Average Selling Price – Promotional Price} > Promotional Price * 10 % and Promote = True | Sales(Q) | [Average Selling Price – Promotional Price] * Sales Quantity |
| Overstock | On Hand > Maximum Quantity On Hand | On Hand - Maximum Quantity On Hand | {Quantity On Hand - Maximum Quantity On Hand } * Average Selling Price |
Exceptions Dashboard
Use the Exceptions dashboard displays summary information about any exceptions that exist in your organization. You can drill-down from the Exceptions dashboard to access the specific exception type report for that row.
-
Exceptions Summary by Product Category
-
Exceptions Summary by Customer
-
Exception Type by Product Category
-
Exception Type by Customer

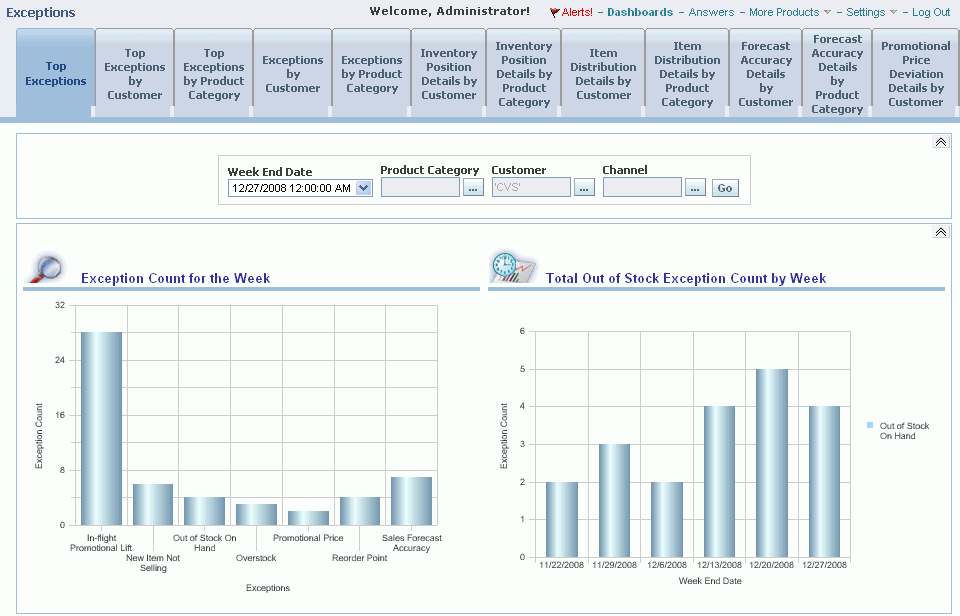
Top Exceptions Dashboard
The Top Exceptions dashboard displays a summary of:
-
Top exceptions for the current week
-
Total out of stock exception count by week
-
Top Exceptions by Product Category
-
Top Exceptions by Customer
You can filter this dashboard by Date, Product Category, Customer, or Channel. Exceptions are displayed by count or monetary value.
Top Exceptions by Customer Dashboard
The Top Exceptions by Customer dashboard displays the largest exceptions by customer, calculated using either count (total exceptions) or dollar value. You can filter this dashboard by Date, Exception Type, Product Category, Customer, or Channel.
Top Exceptions by Product Category
The Top Exceptions by Product Category dashboard displays the largest exceptions by product category, calculated using either count (total exceptions) or dollar value. You can filter this dashboard by Date, Exception Type, Product Category, Customer, or Channel.
Top Exceptions by Customer
The Top Exceptions by Customer dashboard displays the largest exceptions by customer, calculated using either count (total exceptions) or dollar value. You can filter this dashboard by Date, Exception Type, Product Category, Customer, or Channel.
Exceptions Setup
OBIEE iBots are used to write exceptions. Each of the 8 exception types in DSR has a pre-built iBot. You run the iBots after loading new fact data to analyze the new data and generate any new exceptions. Each iBot executes a query which locates exceptions based on an established set of criteria. If you reload fact data because the original data had errors or was incomplete, you can also re-run the iBots to re-generate exceptions. When you run an Exception Management iBot, it will first remove any existing exceptions for the period being analyzed, and then write new exceptions for the period being analyzed using the latest fact data.
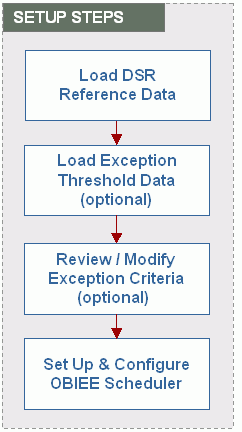
The following diagram shows the setup steps required to configure exceptions in DSR:

Step 1: Load DSR Reference Data
The first step to setting up exception management is to load the prerequisite reference data. This includes:
-
Loading manufacturer reference data such as the manufacturer organization, business calendar, and the manufacturer’s item hierarchy.
-
Loading customer reference data such as the customer organization, item hierarchy and replenishment rules.
Step 2: Load Exception Thresholds
Exception thresholds define a minimum threshold where probability is high if actual sales is below threshold based on expected sales. For Expected Sales, by default DSR uses the sales forecast if it exists. If the forecast is not available, then DSR uses one of two calculations to estimate Expected Sales:
-
Non-promotional items: a median of five previous same-day periods.
-
For promotions: a median of promoted daily sales in past 180 days.
Exceptions are loaded to the table DDR_R_EXCPTN_SLS_THRSHLD.
Step 3: Review Exception Criteria
DSR uses Exception Analyzer Queries to classify queries that are used to locate exceptions. There is one exception analyzer query for each type of exception. When an exception management iBot runs an exception analyzer query, a record is written for each row in the query. The filter criteria within the exception analyzer query determines two things. First, it determines the number of days of related fact data that will be analyzed for exceptions. Exceptions are analyzed for a selected number of days ending with the current day. For example, the last seven or fourteen days. Second, the exception analyzer filter criteria is used to determine whether an exception exists or not. For example, in the case of the out-of-stock on-hand exception, the filter criteria selects records where the on-hand qty is equal to zero.
Because the data in each exception analyzer query is written to the same exception table, the first eight columns of the query must always contain the columns listed here.
-
Mfg Org Code
-
Rtl Org Code
-
Business Unit ID
-
Transaction Date
-
Mfg SKU Item ID
-
Rtl SKU Item ID
-
Exception Qty
-
Exception Amt
Note: Any columns in the query after the first eight are not written to the exception table and are available to help the end user review the exception.
Step 4: Set up Scheduler
The last set up step is to set up and configure the OBIEE scheduler. The scheduler is used to run the iBots which will write the exceptions. You will need to create a file named dbConnections.properties containing the connection information specific to your environment and copy that file to the directory $HOME/OracleBI/web/javahost/lib.
To set up the scheduler, refer to Oracle® Business Intelligence Infrastructure Installation and Configuration Guide, chapter 10 for instructions.
Processing Exceptions
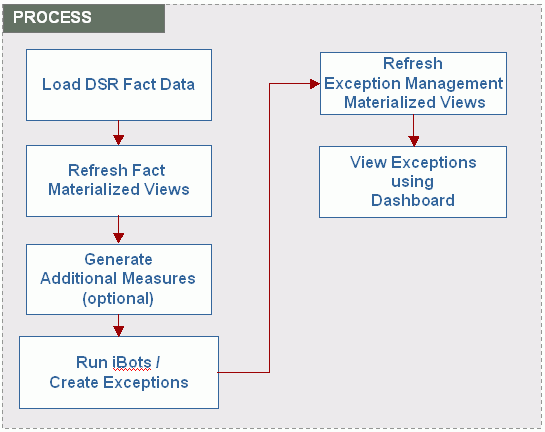
The following diagram illustrates the steps involved in processing exceptions in DSR:

Step 1: Load DSR Fact Data
Once set up is complete, you can start to process exceptions. The first step is to load the related fact data that will be analyzed to see if any exceptions exists Each exception type uses data from one or more fact tables. For example, the Out of Stock (OH=0) exception analyzes the inventory facts to locate records where on-hand is zero. It also uses the sales forecast (if available) to calculate lost sales quantity and amount, which is then used as the exception quantity and amount. The facts that are currently used by exceptions include point of sale, inventory and sales forecast facts.
For more information on loading fact data in DSR, see Fact Data Load Process in the Working with Data chapter.
Step 2: Refresh Materialized Views
Once you have loaded the fact data, you will need to refresh the fact data materialized views. The first time you load fact data you will need to run a complete refresh. Once a complete refresh has been performed, you can run a fast refresh to update the materialized view with changes since the last refresh.
For more information on refreshing materialized views, see Materialized Views in the Working with Data chapter.
Step 3: Generate Additional Measures
Prior to creating exceptions, you’ll want to generate some pre-calculated measures which are used by the exception analyzer queries. This includes:
-
Expected Sales (by BU/SKU/Day).
-
The associated minimum threshold related to the expected sales is fetched from the exception threshold table and stored in the additional measures table.
-
The new items not selling (DDR_B_NEW_ITEM_NO_SLS) table is populated with the new items introduced to the store in the last 30 days. The new item start and end dates are captured along with the date of first sale.
The additional measures are generated by running the Additional Sales Measures process flow. This process flow can be found under the “DSR Exceptions Process Flow” folder in OWB. This process flow calls a PL/SQL procedure which then generates the additional measures. There is no interface table associated to the process flow. The only input required is to ensure the process flow parameters are set appropriately. The process flow parameters allow you to control what measures get created and the amount of fact data that is used when creating additional measures. For example, if you are not implementing the new item not selling exception, then you can bypass the creation of the new item not selling records and improve overall performance.
The following parameters are used in generating the additional measures:
-
Calculate In Flight Promotion – If set to True, calculates Expected Sales Measure and copies the associated min threshold into the additional measures table.
-
Calculate New item not selling – If set to True, populates the new items not selling (DDR_B_NEW_ITEM_NO_SLS) table .
-
Calculate OOS Imputed Measures – If set to true, calculates Expected Sales Measure and copies the associated min threshold into the additional measures table.
-
Customer Organization (optional) – If used, only generates additional measures for the selected customer organization.
-
Offset Days (required) - The number of days of related fact for which additional measures will be created. Additional measures are created for a selected number of days ending with the current day. For example, the last seven or fourteen days.
Step 4: Run iBots
Once you have generated the additional measures, you can then run the iBot to create exceptions. There is one iBot for each exception type:
| iBot Name | Exception Type |
| FCSTACC | Forecast Accuracy |
| IFPL | In-Flight Promotion Lift |
| NPISALES | New Product Introduction |
| OOSIM | Out Of Stock (Imputed) |
| OOSOH | Out Of Stock On Hand |
| OVRSTCK | Overstock |
| PPD | Promotional Price Deviation |
| REORDR | Reorder Point |
Each iBot executes its associated exception analyzer query. For example, the Forecast Accuracy iBot executes the Forecast Accuracy exception analyzer query. You can see the name of the associated exception analyzer query listed in the Conditional Request tab. The mechanism by which the records retrieved from the exception analyzer query get written to the exception table can be found under the Advanced tab. When iBot conditions are satisfied (meaning at least one row was returned by the exception analyzer query), a Java program is called to read the data from the query and write an exception record for each row returned by the query. When iBot conditions are NOT satisfied (meaning no rows were returned by the exception analyzer query), a Java program is called to delete any existing exceptions for the period being analyzed.
Both programs called require the same parameter values. The first parameter is the exception type of the exceptions being written. his value should remain untouched. The second parameter is the exception ID. This value is used to purge exceptions. When processing exception, the program first removes any existing exceptions for the period being analyzed, before writing new exceptions. This allows you to rerun exceptions for the same period in case the fact data was incorrect or incomplete. For example, when processing Forecast Accuracy exceptions for the last 7 days, the program will first purge any forecast accuracy exceptions for the past 7 days that were written by this iBot. The way the program determines what was written by this iBot is that is deletes any records based with the exception ID equal to the second parameter. If you copy and create multiple exception analyzer queries and iBots for any one exception type, you will need to assign a unique exception ID for each iBot.
The last parameter is the offset days. This value must be the same as the offset days used in the associated exception analyzer query. For example, if the exception analyzer query is processing Forecast Accuracy exceptions for the past 7 days, you’ll want to make sure to pass the same number of offset days (7) to these programs. Remember these programs delete any existing exceptions before writing new exceptions, so we want to make sure they are only deleting exceptions for the period being processed.
Step 5: Refresh Materialized Views
Once exceptions have been created, you will need to refresh the exception data materialized views. The first time you load exception data you will need to run a complete refresh. Once a complete refresh has been performed, you can run a fast refresh to update the materialized view with changes since the last refresh. The exception materialized views can be refreshed by running the complete reference process flow or fast refresh process flow found under the DSR Exceptions Process Flows folder in OWB.
Step 6: View Exceptions
Once the exception materialized views have been refreshed, you can use the Exception Management dashboard to view and analyze exceptions and to drilldown into detailed reports.