Introduction to Oracle Incentive Compensation Analytics for Oracle Data Integrator
This chapter covers the following topics:
- Oracle Incentive Compensation Analytics for Oracle Data Integrator Overview
- Technology Overview
- Architecture Overview
- Datamart Overview
- Plan Modeling Overview
- Dashboards and Reports Overview
Oracle Incentive Compensation Analytics for Oracle Data Integrator Overview
Oracle Incentive Compensation (OIC) Analytics for Oracle Data Integrator (ODI) is a reporting and analysis framework that enables compensation managers, compensation analysts, plan administrators, and sales managers to access/view relevant and accurate information using dashboards and reports.
OIC Analytics for ODI helps track rewards based on individual and team achievements relative to organization performance and profit targets. OIC Analytics for ODI helps sales executives, finance staff, and compensation analysts and designers gain insight and visibility into designing and optimizing solutions to drive stronger performance, which results in better incentives. OIC Analytics for ODI increases visibility into the following aspects of business:
-
Selling behavior relative to quotas
-
Compensation plan designs for optimizing sales
-
Compensation expenditure management
OIC deals with huge volumes of data about sales, quotas, and payout information. OIC Analytics for ODI presents this data in a meaningful way in a role based method, which helps users make informed decisions and manage compensation plans.
Technology Overview
OIC Analytics for ODI uses the following technologies:
-
Oracle Data Integrator (ODI)
-
Oracle Business Intelligence Enterprise Edition (OBIEE)
ODI is a comprehensive data integration platform that covers all data integration requirements from high-volume, high-performance batches, to event-driven, trickle-feed integration processes, to SOA-enabled data services. ODI is the E-Business suite standard for Extract Transform Load (ETL) processing.
For more information on ETL, see ETL Processing.
The OBIEE platform is a comprehensive suite of enterprise Business Intelligence (BI) products, delivering interactive dashboards, BI servers, and BI answers.
ODI copies data from the source (OLTP system) to the target datamart tables, using ETL processing technology. OBIEE then renders the dashboard reports to the users based on this data.
Architecture Overview
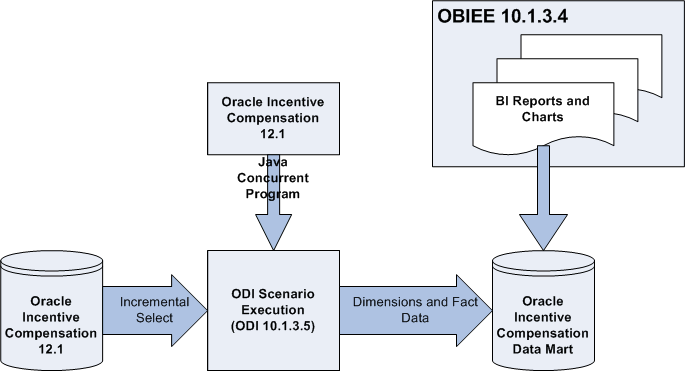
The following diagram provides an overview of OIC Analytics:
The OIC source system supplies data to the OIC Analytics system. This data is read by the ODI Scenario Execution system, which moves the data to OIC datamart into different dimensions and facts tables. The OBIEE then generates reports and charts based on data stored in the datamart tables.

Datamart Overview
OIC datamart tables are structured to meet the needs of compensation analysts, compensation managers, plan administrators, and sales managers. It provides the infrastructure to feed, store, and access the data for reporting purpose.
OIC datamart extracts and stores the relationship data logic, facts, and dimensions that drive the analytics solution for an organization, based on its goals and structure. It is a subset of the master data storage, and data extracted from the OIC application tables is logically distributed here.
Data can originate from multiple heterogeneous sources, including OIC, and be mapped into the datamart to be utilized in OBIEE reporting. ODI artifacts are used to extract data from source to load and transfer them into the OIC datamart tables.
Plan Modeling Overview
Plan modeling allows users to test assumptions regarding compensation plan elements, and predict outcomes in preparation for introducing new plans or modifying established ones. OIC modeling has the following capabilities:
-
Data access: OIC presents libraries of datasets extracted from underlying systems to support modeling. Plan administrators can segment or combine data as appropriate to analyze reports.
-
‘What if’ analysis: Users can create, compare, and modify different compensation scenarios against actual performance data to analyze income and expense implications.
Dashboards and Reports Overview
The OBIEE dashboards are tailored for an end users' role in an organization. Users with different OIC responsibilities have access to different dashboards and reports. These dashboards allow users to view various reports and then make analytical decisions based on the data in these reports. For example, the Plan Administrator dashboard is used to model compensation plans.
These are the OBIEE dashboards and reports that are available:
| Dashboard Page | Report |
|---|---|
| Compensation Cost Summary | Compensation Cost by Plan |
| Compensation Cost Summary | Compensation Cost of Sales by Quarter |
| Compensation Cost Summary | Compensation Summary by Quarter |
| Plan Performance Summary | Attainment Summary by Quarter |
| Plan Performance Summary | Attainment vs. Quota by Plan |
| Plan Performance Summary | Incentive Investment Matrix |
| Performance Summary | Salesrep Ranking |
| Performance Summary | Attainment Summary by Quarter |
| Performance Summary | Compensation Summary by Quarter |
| Plan Effectiveness | Attainment versus Quota |
| Plan Effectiveness | Earnings Distribution by Attainment |
| Plan Effectiveness | Sales Investment Matrix |
| Scenario Comparison | Compensation Cost Summary |
| Scenario Comparison | Attainment vs. Quota and Actual |
| Scenario Comparison | Incentive Investment Matrix |
| Plan Comparison | Incentive Investment Matrix by Plan |
| Plan Comparison | Attainment vs. Quota by Plan |
For more information on mapping between users and dashboards, see Mapping Between Dashboards and User.