| Oracle® Argus Insight Cognos User's Guide, Release 6.0 E18253-01 |
|
 Previous |
 Next |
Dashboard Indicator reports are special reports that provide an insight into key parameters that let you monitor product performance and workflow efficiency. These reports are generated directly from the datamart so they display the latest data.
Argus Insight has three Dashboard Indicator reports: Executives, Reporting, and Data Entry. Each of these reports consist of a number of sub-reports, as the following table shows.
| Dashboard Indicator Report | Sub Report | |
|---|---|---|
| Name | Description | |
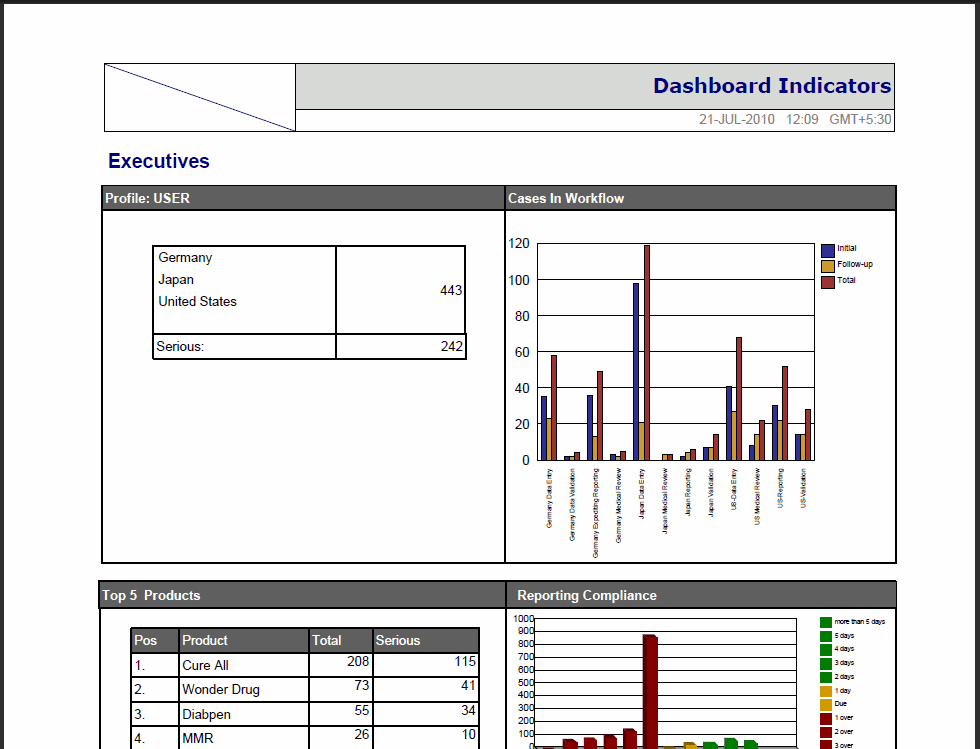
| Executives | Executives Profile | This report provides a tabulation of case count for each site. The total count of serious cases for all sites is also listed. |
| Top 5 Products | This report is a listing of the top 5 products having the largest total case count sorted in descending order. The serious case count for each product is also listed. | |
| Cases in Workflow | This report is a graphical summary of the initial, follow up, and total case count in each workflow state. | |
| Late Reports | This report is a detailed listing of all cases for which reports are past the due date. Days past due are provided for each destination. | |
| Reporting Compliance | This report provides a graphical overview of reporting compliance count broken down by days remaining to due date and days past due date. | |
| Receipt Latency | This report provides a graphical overview of receipt latency (from initial receipt date to central received date) by country of origin. | |
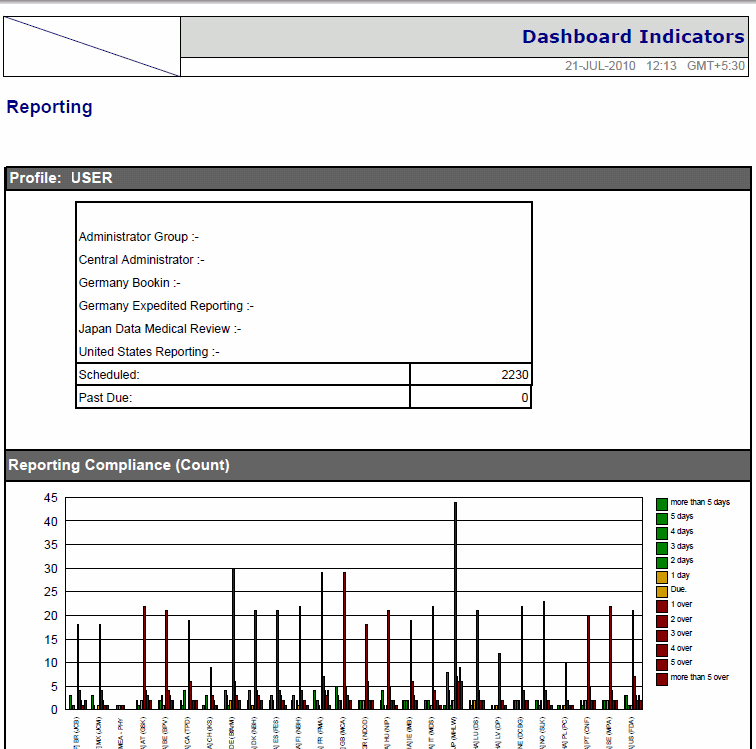
| Reporting | Reporting Profile | This report is a summary of scheduled report and past due report count for all the reporting groups. |
| Reporting Compliance (Count) | This report provides a graphical overview of reporting compliance count for each reporting destination. The counts are broken down by days remaining to due date and days past due date. | |
| Reporting Compliance (Percentage) | This report provides a graphical overview of reporting compliance percentage broken down by days remaining to due date and days past due date. | |
| Outstanding Submissions by Responsible Group (Summary) | For the selected reporting groups, this report shows the outstanding report count by reporting destinations. Against each destination, the outstanding reported count is further broken up in these groups:
- Due in greater than seven days - Due in 3-7 Days - Due in 0-2 days - Past the due date |
|
| Outstanding Submissions by Responsible Group (Listing) | This report provides a detailed listing of cases for which report submissions are coming up.
The listing is grouped by the responsible group. Within each group, the listing is sorted in ascending order of days remaining for submission. |
|
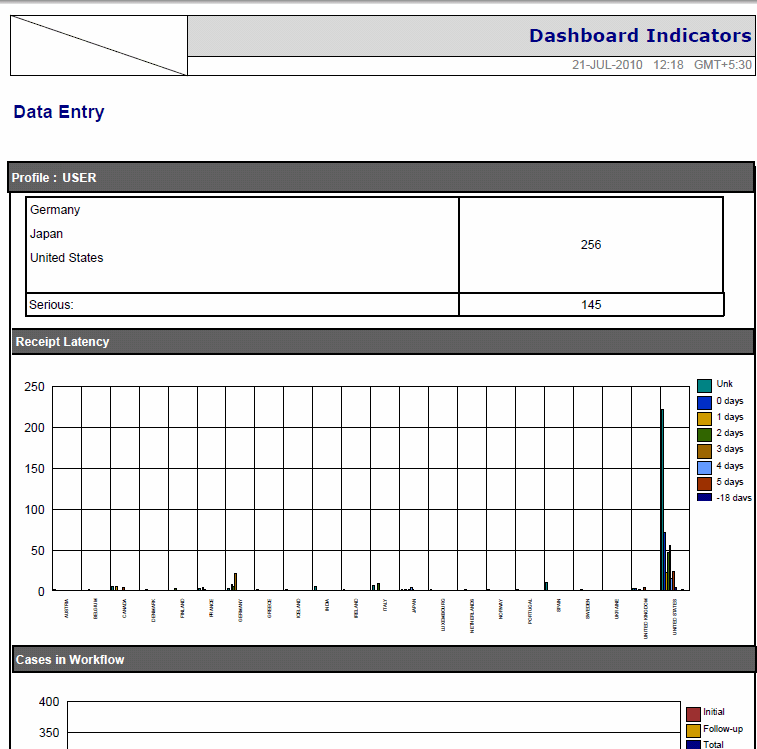
| Data Entry | Data Entry Profile | This report provides a tabulation of case count for each site. The total count of serious cases for all sites is also listed. |
| Receipt Latency | This report provides a graphical overview of receipt latency (from initial receipt date to central received date) by country of origin. | |
| Cases in Workflow | This report is a graphical summary of the initial, follow up, and total case count in each workflow state. | |
| Case Load | This report provides a tabulation of cases received, cases in processing, and pending case counts for each workflow state. | |
| Case Workload by Site and Country | This report provides a tabulation of serious, non-serious, and total case counts grouped by site. For each site, the counts are displayed for each country. | |
Depending on your profile and reporting requirements, the system administrator configures and assigns a specific Dashboard Indicator report to you.
To view the pre-configured Dashboard Indicator report assigned to you, select Datamart Reports > Dashboard Indicator. The report (PDF format) opens in a separate browser window. The samples for each report type are provided below:
Executives

Reporting

Data Entry
