Chapter 9 Getting Status and Managing Logs
This chapter describes the following tasks associated with the Information page in the administration GUI:
-
Viewing status information
-
Viewing SKIP statistics
-
Viewing logs
-
Setting the log retrieval mode
-
Setting a log viewing filter
-
Saving and clearing the log
-
Changing the log file size for a Screen
The Information Page
The Information page provides statistics, logs, and other information, such as system boot time, SunScreen boot time, version, and information about high availability. To display the Information page, click the Information button in the SunScreen banner.
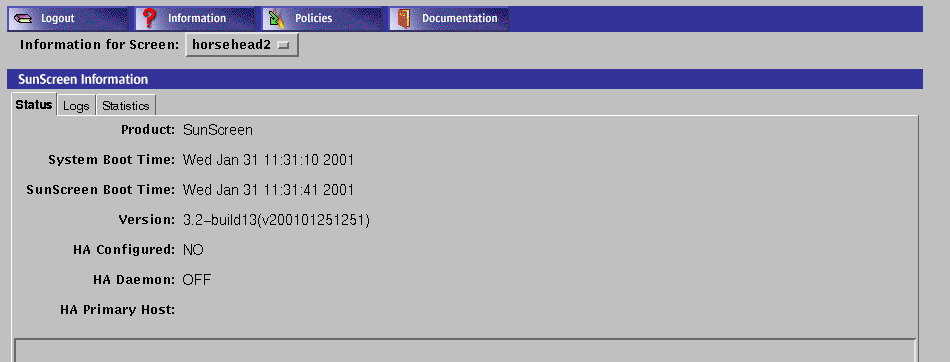
Status Information
To View Status Information
-
Click the Information button in the SunScreen banner.
The Information page displays.
-
Click the Status tab.
The Status page displays.
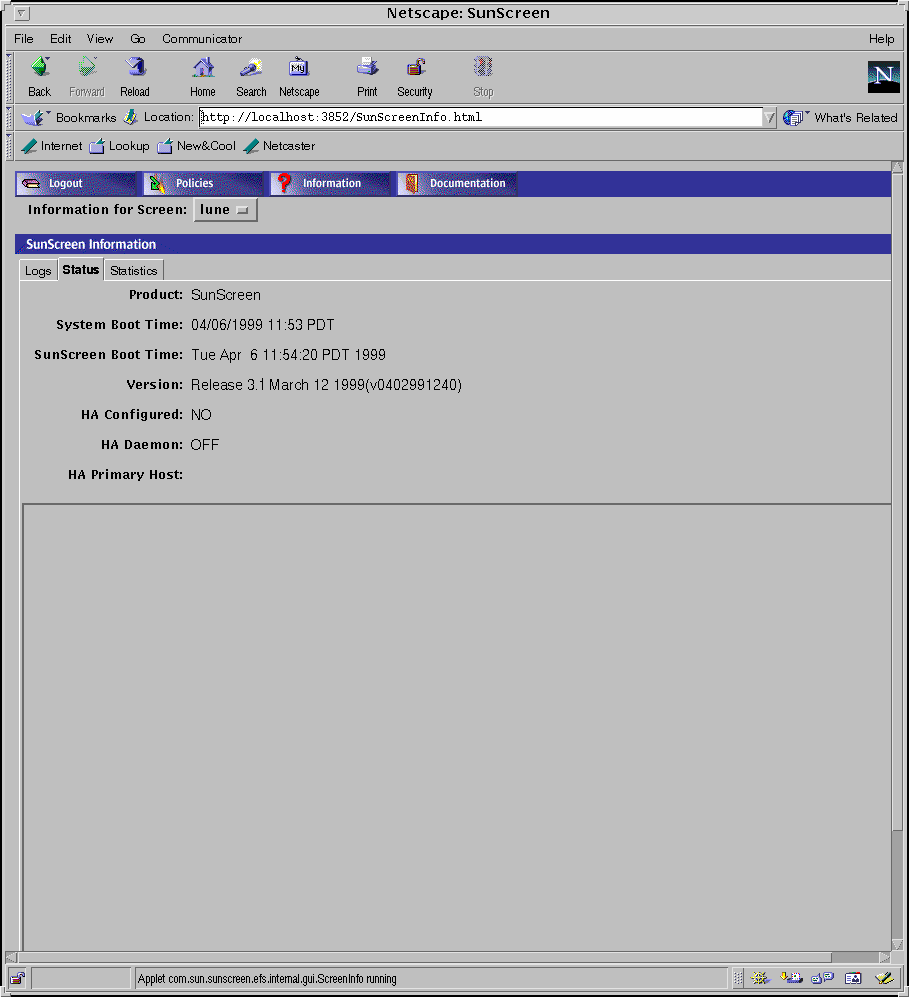
The Status page shows SunScreen product information as well as HA configuration information.
The following table describes the information presented on this page.
Table 9-1 Status Information|
Title |
Description |
|---|---|
|
Product |
The name of the software product. |
|
System Boot Time |
Date and time when the system was last restarted. |
|
SunScreen Boot Time |
Date and time when the system was last restarted. |
|
Version |
The release of the software that is running. |
|
HA Configured |
Whether high availability (HA) is configured (YES or NO). |
|
HA Daemon |
Whether the high availability daemon is running (OFF or ON). If the HA daemon is running, the members of the HA cluster appear in the area below along with the state of each member of the HA cluster (Active or Passive). |
|
HA Primary Host |
The name or IP address of the primary host of the high availability cluster. |
|
Host Names |
Lists the hosts configured for HA. This information appears in the area set off from the rest of the information and is updated by default every 30 seconds. You can change the update interval by changing the poll interval in the Logs tab. |
|
Status |
Shows the status of the primary and secondary HA hosts. The status is ACTIVE, PASSIVE, and NONRESPONSIVE. This information appears in the area set off from the rest of the information and is updated by default every 30 seconds. You can change the update interval by changing the poll interval in the Logs tab. |
|
Help button |
Displays the online help for this page. |
Log Page
To View the Log Page
-
Click the Information button in the SunScreen banner.
The Information page displays.
-
Click the Log tab.
The Log page displays.
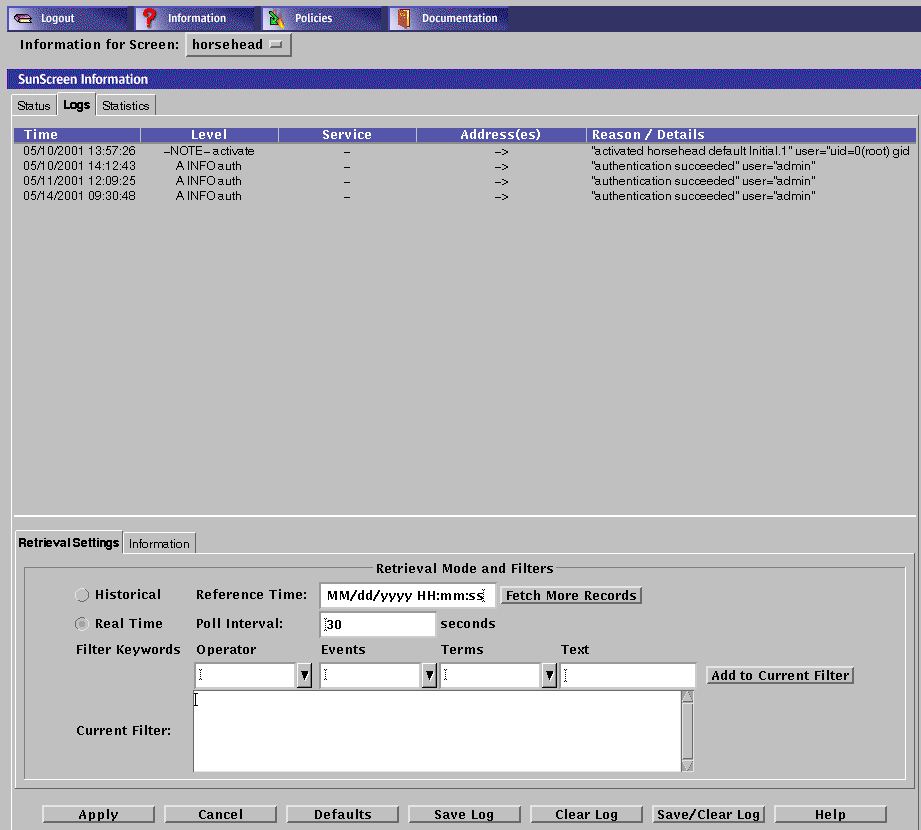
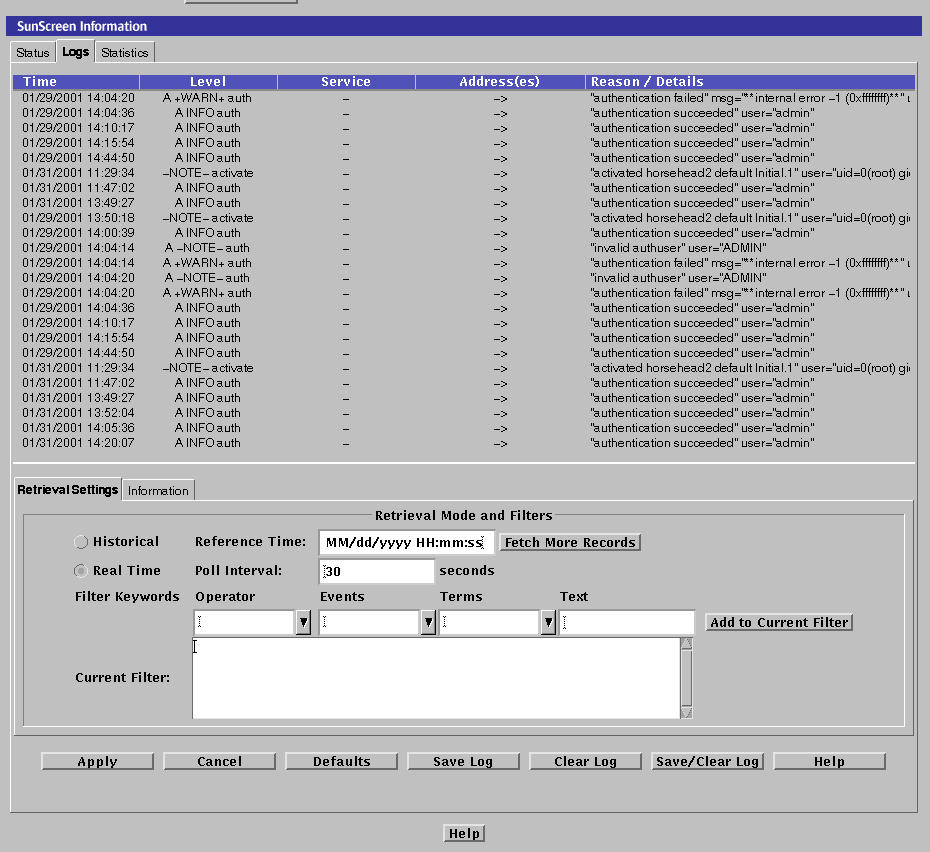
The following table describes the column headings for the log panel of the SunScreen Information page.
Table 9-2 Column Headings on the Log Panel of the SunScreen Information Page|
Field |
Description |
|---|---|
|
Time |
Indicates the time that the packet or event represented by this record was logged by the Screen. Use this time field to retrieve records in Historical mode as set in the Log Browser Tab Retrieval Setting. |
|
Level |
Indicates the type and severity level of the logged event. |
|
Service |
Indicates the network service or protocol, such as TCP, IP, NFS, Telnet, or HTTP, over which this packet was sent or to which the event is related. |
|
Address(es) |
Shows the address from which and to which a packet was sent. Arrows indicate direction. Some events that, by themselves, are not related to IP traffic will not have an address or addresses, as shown in the example. |
|
Reason/Detail |
Shows the reason a packet or event was logged or the detail regarding the logging. This information depends on the requirements of the rules within a policy. |
The logs tab also displays the Retrieval Setting tab and Information tab for the logs.
Logged packets are configured in the packet filtering rules so that a packet or an event is displayed which meets the requirements of a rule in a policy. The log has two retrieval modes: Historical and Real Time.
-
The Historical mode allows you to examine a particular segment for a particular time.
-
The Real Time mode displays information as the packets pass through the Screen while you are looking at the log.
Retrieval Setting Tab
The following table describes the controls on the Retrieval Setting tab.
Table 9-3 Controls on the Retrieval Setting Tab|
Control |
Description |
|---|---|
|
Retrieval Mode radio buttons |
Specifies the time frame for which you want log messages:
|
|
Fetch More Records button |
Retrieves more log records in the historical mode only. If you check Historical Reference Time and click the Apply button after specifying a date and time for retrieving records, the display will retrieve log records using the date and time that the log file was last cleared. Using this button, you can display the next screen of later records. |
|
Filter Keywords field |
Provide the ability to create many simple filtering expressions from the choice lists available. These controls reduce typing effort as well as serving as reminders of filtering options. For more detail, see the following section, "Setting a Log Viewing Filter". |
|
Add to Current Filter button |
Causes these items chosen in the Filter Keywords fields to be added to the Filter Keywords text entry box at its current insertion pointer. For more detail, see the following section, "Setting a Log Viewing Filter". It adds all text that is currently selected in the four combo boxes. |
|
Current Filter text box |
Allows you to enter an expression of the log-browser filtering language. An arbitrary logdump expression can be entered there and activated using the Apply button. For more detail, see "Setting a Log Viewing Filter" below. |
Setting a Log Viewing Filter
The Log Browser filters log events to be displayed. The language that it uses is identical to the filtering options of the logdump command in the command-line program; it is a superset of the language used by the Solaris snoop packet monitor tool.
You have full access to this language typing an arbitrary logdump expression in the Current Filter text entry box in its Retrieval Settings tab and clicking the Apply button to activate it.
In addition, the Filter Keywords controls provide the ability to create many simple filtering expressions. These controls reduce typing effort as well as serving as reminders of filtering options.
The Filter Keywords controls are used by selecting one or more operations from their choice lists or entering a target (operand) in the Text box. After choosing or typing your entry, click the Add to Current Filter button to add these items to the Filter Keywords text entry box at its current insertion pointer.
The leftmost editable combo box contains the Boolean operators and, or, and not.
The Events box provides filtering terms that are complete and restrict the type of log event displayed. The following table describes the terms in the Events box.
Table 9-4 Filter Terms of the Events Box|
Term |
Description |
|---|---|
|
loglvl pkt |
Allows displaying network packet-type events |
|
loglvl sess |
Allows displaying network session-type events |
|
loglvl auth |
Allows displaying events related to authentication operations |
|
loglvl app |
Allows displaying events related to screen application (usually proxy) operations |
|
logapp activate |
Allows displaying events related to policy activation. |
|
logapp auth |
Allows displaying events from the authentication subsystem |
|
logapp compiler |
Allows displaying events related to policy compilation |
|
logapp edit |
Allows displaying events related to registry or policy editing |
|
logapp ftpp |
Allows displaying events from the FTP proxy |
|
logapp ha |
Allows displaying events related to HA operation |
|
logapp httpp |
Allows displaying events from the HTTP proxy |
|
logapp iked |
Allows displaying events related to the IKE daemon |
|
logapp log |
Allows displaying events related to the logging facilities themselves |
|
logapp restore |
Allows displaying events related to policy restoration |
|
logapp scan |
Allows displaying events related to proxy content scanning and redirection |
|
logapp smtpp |
Allows displaying events from the SMTP proxy |
|
logapp telnetp |
Allows displaying events from the Telnet proxy |
|
logsev emerg |
Allows displaying events of an emergency severity |
|
logsev alert |
Allows displaying events of an alert severity or above |
|
logsev crit |
Allows displaying events of a critical severity or above |
|
logsev err |
Allows displaying events of an erroneous severity or above |
|
logsev warn |
Allows displaying events of a warning severity or above |
|
logsev note |
Allows displaying events of a notice severity or above |
|
logsev info |
Allows displaying events of an informative severity or above (all events that are not of debug severity) |
|
logsev debug |
Allows displaying events of a debug severity or above (all events) |
TheTerms box provides filtering terms most of which are incomplete and require an operand value, You type these in the Text box. They are added to the choice list of the Text box for reference so that you need not retype the value if you want to use it again. The following table describes the filter terms in the Terms box.
Table 9-5 Filter Terms in the Terms Box|
Term |
Description |
|---|---|
|
logwhy reason# |
Restricts display to packets that have the given logging reason why code |
|
logiface iface |
Restricts display to packets that arrived on the interface named iface |
|
host hostname |
Restricts display to events either from or to hostname |
|
dst hostname |
Restricts display to events destined for hostname |
|
src hostname |
Restricts display to events origination from hostname |
|
port hostname |
Restricts display to events related to the service svcname |
|
dstport hostname |
Restricts display to events targeted to the service svcname |
|
srcport svcname |
Restricts display to events originating from the service svcname |
|
net netaddr |
Restricts display to events either from or to the network whose number is netaddr |
|
udp |
Restricts display to events related to the UDP transport protocol |
|
tcp |
Restricts display to events related to the TCP transport protocol |
|
icmp |
Restricts display to packets of the ICMP control protocol |
|
rpc |
Restricts display to packets of the RPC protocol |
The terms in italics are variables for which you must supply a value or values in the when you choose this term from the choice list. The values for the variable are as follow:
-
reason # The reason number is shown in "Error Messages" in SunScreen 3.2 Administrator's Overview.
-
hostname can be:
-
svcname can be:
-
A numeric TCP or UDP port number (for example, 23 for Telnet)
-
A numeric TCP or UDP port number range (for example, 6000. .6023 for X windows)
-
A service name known to the screen's naming service (for example, domain found in /etc/services)
-
-
iface can be:
-
The name of an interface (for example hme0)
-
-
netaddr can be:
-
The IP network number (for example 199.12.200)
-
The Information Tab
The log-browser Information tab on the Screen Information page and shown in below provides the statistics for the current log.
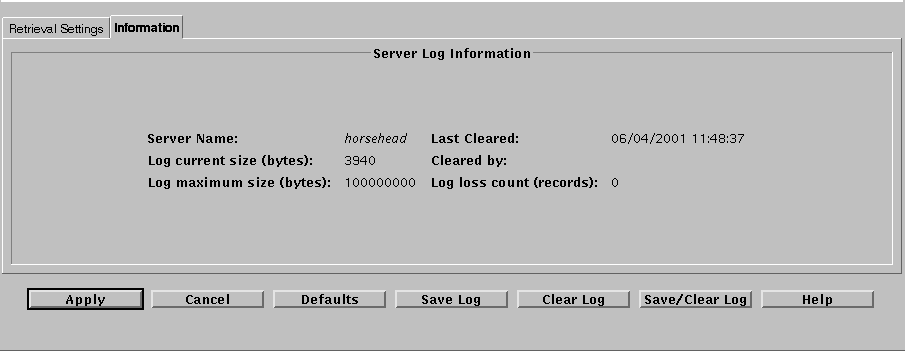
The following table describes the fields on the Information tab. You cannot edit the fields on this page.
Table 9-6 Fields on the Information Tab|
Control |
Description |
|---|---|
|
Server Name field |
Indicates the name of the Screen to which the Log Browser is connected. |
|
Log current size field (bytes) |
Indicates the current size of the log file in bytes on the server. |
|
Log maximum size field (bytes) |
Indicates the maximum size of the log file in bytes on the server. |
|
Last Cleared field |
Indicates the date and time the log file was last cleared. |
|
Cleared By field |
Identifies the login name of the administrator who last cleared the log file. |
|
Log loss count (records) field |
Indicates the number of log records that have been thrown away since the last "clear" operation. Log records are lost if the log grows beyond its maximum size or if the file system on which the log is written fills before that maximum is reached. Packets that cannot be logged because the traffic load exceeds the logger's ability to store entries are not counted. |
Action Buttons
The following table describes the action buttons on the SunScreen Information Page.
Table 9-7 Action Buttons on the SunScreen Information Page
Statistics Page
To View the Statistics Page
-
Click the Information button in the SunScreen banner.
The Information page displays.
-
Click the Statistics tab.
The Statistics page displays.
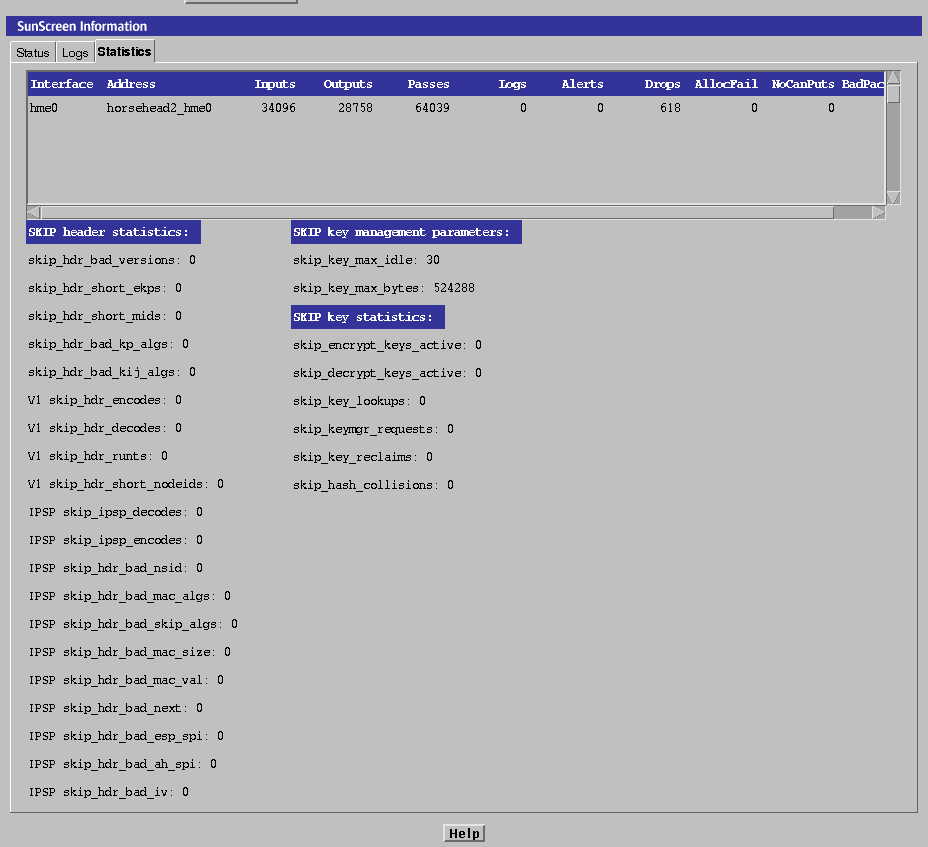
The Traffic Statistics panel displays traffic statistics for each interface on the Screen. The following table describes the fields on the Traffic Statistics panel of the Statistics tab. The values displayed in these fields cannot be modified.
Table 9-8 Controls on the Traffic Statistics Panel of the Statistics Page|
Control |
Description |
|---|---|
|
Interface field |
Name of the interface. |
|
Address field |
Address of the interface. |
|
Inputs field |
Total number of packets seen on that network interface. This number includes packets processed by the Screen and intranet traffic. Because this counter records more than just the number of packets through the interface, the number can be much higher than the sum of the numbers in the Passes and Drops fields, which record the number of packets passed and dropped. |
|
Outputs field |
Total number of packets passed from other interfaces on the Screen and sent out over this interface. |
|
Passes field |
Number of packets received from another interface, matched to an ALLOW rule exactly, and sent out over the designated interface. |
|
Logs field |
Number of packets that have been logged by the Screen according to the actions in the active configuration. |
|
Alerts field |
Number of SNMP alerts generated because of the traffic on this network interface. |
|
Drops field |
Number of packets that have been dropped, either as a result of exactly matching a DENY rule or as a result of not matching any rule and being dropped as the default action of the Screen's interface. |
|
AllocFail field |
Error counter for packets lost because of the lack of resources. |
|
NoCanPuts field |
Error counter for packets lost because of the lack of stream flow control. |
|
BadPackets field |
Error counter for packets lost because of errors. |
The SKIP Statistics panel shows the SKIP statistics for the SunScreen. The following table describes the fields on the SKIP Statistics panel of the Statistics page. The values displayed in these fields cannot be modified.
Table 9-9 Controls on the SKIP Statistics Panel of the Statistics Tab|
Control |
Description |
|---|---|
|
skip_hdr_bad_versions field |
Total number of SKIP headers with invalid protocol versions. |
|
skip_hdr_short_ekps field |
Number of SKIP headers with short encrypted packet fields. |
|
skip_hdr_short_mids field |
Number of SKIP headers with short MID fields. |
|
skip_hdr_bad_kp_algs field |
Number of SKIP headers with unknown cryptographic algorithms. |
|
V1 skip_hdr_encodes field |
Number of SKIP V1 headers encoded. |
|
V1 skip_hdr_decodes field |
Number of SKIP V1 headers decoded. |
|
V1 skip_hdr_runts field |
Number of SKIP V1 headers with short packets. |
|
V1 skip_hdr_short_nodeids field |
Number of SKIP V1 headers with short node identifiers. |
|
IPSP skip_ipsp_decodes field |
Number of SKIP V2 headers decoded. |
|
IPSP skip_ipsp_encodes field |
Number of SKIP V2 headers encoded. |
|
IPSP skip_hdr_bad_nsid field |
Number of headers with a bad V2 name space identifier. |
|
IPSP skip_hdr_bad_mac_algs field |
Number of headers with unknown or bad authentication algorithms. |
|
IPSP skip_hdr_bad_mac_size field |
The number of headers with an authentication error in the MAC size. |
|
IPSP skip_hdr_bad_mac_val field |
The number of headers with an authentication error in the MAC value. |
|
IPSP skip_hdr_bad_next field |
Number of headers with a bad Next Protocol field. |
|
IPSP skip_hdr_bad_esp_spi field |
Number of headers with a bad V2 SPI field. |
|
IPSP skip_hdr_bad_ah_spi field |
Number of headers with a bad V2 AH SPI field. |
|
IPSP skip_hdr_bad_iv field |
Number of headers with a bad V2 initialization vector. |
|
IPSP skip_hdr_bad_short_r_mkeyid field |
Number of headers with a short V2 receiver key identifier. |
|
IPSP skip_hdr_bad_short_s_mkeyid field |
Number of headers with a short V2 sender key identifier. |
|
IPSP skip_hdr_bad_bad_r_mkeyid field |
Number of headers with a bad V2 receiver key identifier. |
|
skip_key_max_idle field |
Time, in seconds, until an unused key is reclaimed. |
|
skip_key_max_bytes field |
Maximum number of bytes to encrypt before discarding a key. |
|
skip_encrypt_keys_active field |
Number of encryption keys in the cache. |
|
skip_decrypt_keys_active field |
Number of decryption keys in the cache. |
|
skip_key_lookups field |
Total number of key cache lookups. |
|
skip_keymgr_requests field |
Total number of key cache misses (key not found). |
|
skip_key-reclaims field |
Total number of key entries reclaimed. |
|
skip_hash_collisions field |
Total number of table collisions. |
Viewing Statistics
The Statistics area shows SKIP and traffic statistics for each network interface. Fields for the interface, SKIP key management, SKIP key statistics, and SKIP header statistics are described in "Logging" in SunScreen 3.2 Administrator's Overview.
To See the SKIP Statistics
-
Click the Information button in the SunScreen banner.
The Information page displays.
-
The Statistics page displays.

Viewing Logs
Use the Log tab to view logged packets. You can configure policies in the packet filtering rules so that a packet is logged when it matches, or does not match, a particular policy rule criterion. For a complete description of logs, filtering, and retrieval settings, see "Logging" in SunScreen 3.2 Administrator's Overview.
To Set the Retrieval Mode
You can view packet activity logs in two modes: real time and historical (for a specified time period).
-
Click the Information button in the SunScreen banner.
-
Click the Log tab in the Information page.
The Log page displays.
-
Click the Retrieval Settings tab at the bottom of the log.
To Set a Log Viewing Filter
-
Click the Information button in the SunScreen banner.
-
Select or type a Boolean operator (AND, OR, or NOT) in the Operator Filter Keywords fields.

-
Either type the entire filter directly into the Current Filter field or perform the following steps:
-
Select or type a filtering term in the Events Filter Keywords field.
-
Select or type a filtering term in the Terms Filter Keywords field.
-
Click Add to Current Filter to add the items to the Current Filter field at the cursor insertion point.
-
Click Apply to activate the filter.
Note -For listings of the terms and values permitted in the four Filter Keywords fields, see the SunScreen 3.2 Administrator's Overview.
For example, you can type host in the Term field and your machine name in the Text field to only see records that apply to your machine.
-
Saving and Clearing the Log
The size of your network configuration and the logging rules you specify can cause log files to become extremely large. You should save and clear them periodically to prevent losing information. The default log size is 100MB, but it is configurable. If the log file fills up, the oldest data in the log is overwritten and information is lost. All Admin Users except those with an access level of STATUS can perform Save or Clear operations on the logs.
Some browsers do not allow you to save log files because save operations involve a local write operation, which is not allowed by the Java security model. If you use Netscape Navigator or Internet Explorer, you must use the Java Plug-In to enable save operations. The HotJava browser will allow you to perform these operations without the Java Plug-In with the medium/low security level set.
Note -
Saving a log to a file does not clear the log records from the Log page.
To Save the Log
-
From the Information page, click the Log button.
The Log page appears.

-
Click the Save Log button at the bottom of the Log page.
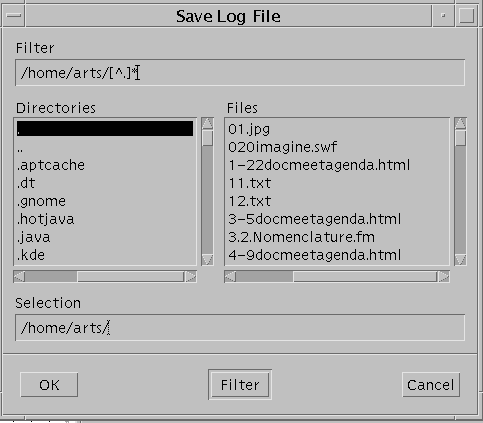
The Save File dialog box appears.
-
Type the full path (including file name) of the file where you want to store logs.
-
Click the OK button.
To Clear the Log
The following steps clear the page of any log records without saving the records or the log file.
To Save and Clear the Log
The following steps clear the display of any log records and save the log file.
-
From the Information page, click the Log button.
The Log page appears.

-
Click the Save/Clear Log button.
The Save File dialog box appears.
-
Type the full path (including file name) of the file where you want to store logs.
-
Click the Save button.
Changing the Size of the Log File
The global size of log files is set like other configuration items and controlled by the LogSize variable. You can set this variable with the command-line interface but not with the administration GUI; however, you can use the administration GUI to set the size of the log file for a specific Screen. The default log size is 100MB, but it is configurable. If the log file fills up, it will overwrite the oldest data and information can be lost.
Note -
The log file for a Screen is resized only when that Screen is restarted.
To Change the Log File Size for a Specific Screen
-
Select the desired Common Object Type.

-
Click the Search button.
-
Select the entry from the Results area.
-
Click the Edit button.
-
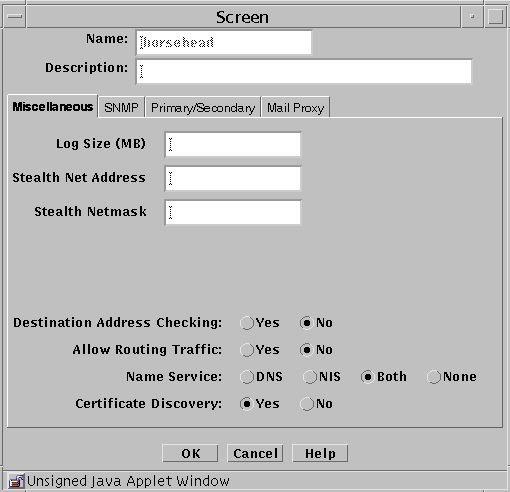
Under the Miscellaneous tab, change the Log Size entry.
-
Click OK
-
Click the Save Changes button at the top of the Panel.
-
Click the Activate Policy button at the top of the panel.
-
Reboot the system.
Your changes to the log file size take effect when you reboot the computer.
Virus Scanning
The SunScreen HTTP proxy can be configured to use the third-party content scanning product InterScan (TM) from TrendMicro, Inc. See SunScreen 3.2 Administrator's Overviewfor information on using InterScan VirusWall
- © 2010, Oracle Corporation and/or its affiliates
