Selecting Display Options
The Sampling Analyzer associates each data type with one or two display options, depending on the nature of the actual data.
Select one of the display options shown in Table 2-2 from the Display list box.
Table 2-2 Display Options for Specific Data Types| Display Option | Information Presented |
|---|---|
|
Overview |
The default display gives a high-level overview of performance behavior |
|
Histogram |
Summary of the amount of time spent executing functions, files, and load objects |
|
Cumulative |
Cumulative amount of time spent by a function, file, or load object, including the time spent in called functions, files, or segments |
|
Address Space |
Information about memory usage |
|
Statistics |
Aggregate data about performance and system resource usage |
The Overview Display
For each sample, the Overview display (see Figure 2-4) shows the amount of time the application spends in different process states. The Sampling Collector always gathers this data during the data collection process, so the Overview display appears by default whenever an experiment is loaded into the Sampling Analyzer.
The Overview display option:
-
Provides a high-level overview of the performance behavior of an application
-
Provides data about how your application's execution time breaks down into different performance areas, helping you identify CPU bottlenecks, I/O bottlenecks, and paging bottlenecks
-
Shows how application performance changes during execution (for example, early parts of the execution might be I/O-bound, while later parts might be CPU-bound)
Figure 2-4 Overview Display
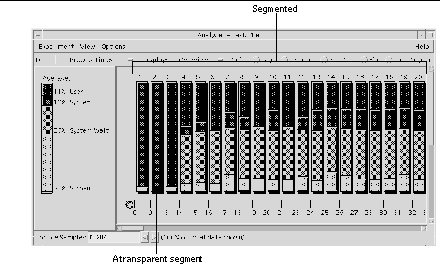
The Overview display contains numbered sample columns made up of segmented bars. Each column represents individual samples collected during an experiment.
The segments inside each column represent different performance areas. The height of each segment is proportional to the time spent in each performance area.
The shade that represents a specific performance area is consistent across all the sample columns in the experiment and across other experiments as well.
A transparent segment is a segment the same color as the foreground of the display pane. It represents performance areas too small to display individually. To see exactly which performance areas are contained in a transparent segment, click the segment's column and choose View Show Details to open the Sample Details dialog box (see Figure 2-5).
Figure 2-5 Sample Details Dialog Box
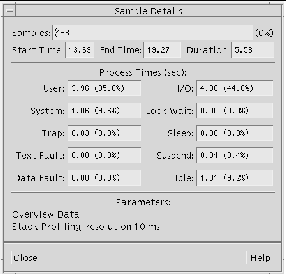
The fields in the dialog box contain the following information about the selected samples.
| Samples | Samples currently selected and the percentage of the experiment they represent |
| Start Time | Start time of the sample |
| End Time | End time of the sample |
| Duration | Duration of the sample |
| User | Time spent executing application instructions |
| System | Time the operating system spent executing system calls |
| Trap | Time spent executing traps (automatic exceptions or memory faults) |
| Text Fault | The time spent faulting in text pages |
| Data Fault | The time spent faulting in data pages |
| I/O | Time spent in program I/0 |
| Lock Wait | Time spent waiting for lightweight process locks to be released |
| Sleep | Time the program spent sleeping (due to any cause other than Text Fault, Data Fault, System Wait, or Lock Wait) |
| Suspend | Time spent suspended (including time spent in the debugger when it encounters breakpoints) |
| Idle | Time spent idle |
| Parameters | List of the data parameters collected for each sample (set in the Sampling Collector before beginning the experiment) |
The Histogram Display
The Histogram display (see Figure 2-6) shows how much time an application spends executing functions, files, or load objects.
The Histogram display option is available for the following data types:
-
User Time
-
System Wait Time
-
System Time
-
Text Page Fault Time
-
Data Page Fault Time
Figure 2-6 Histogram Display Showing Time Spent Executing Functions
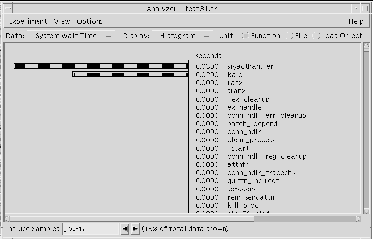
To view your application's performance data at various levels of compilation granularity, choose one of the following unit types:
| Function | Time your application spent executing functions |
| File |
Time spent executing file-level units. This view is useful if your application has a large number of functions. All data for a single source file is displayed together. Note: If any part of the executable (including shared libraries) is not compiled with the -g option, the Sampling Collector may not have enough information to associate functions with their containing files. |
| Load Object |
Time spent executing text segments |
You can select which samples to include in the Histogram display in three ways:
-
Type sample numbers directly into the Includes Samples text field: separate numbers with commas (1,3,6), and define ranges using a hyphen (1-6).
-
Select the columns containing those samples while still in the Overview display.
-
Choose either View > Select or View > Select None while still in the Overview display to include or exclude all samples in the experiment.
To select which segments to include in the Histogram display, choose View Segments Included from Files to open the Segments Included from Files dialog. Click any segments and click Apply, or click the Select All button to select all segments.
To sort the Histogram display, choose View > Sort by and select either Values (descending by time value) or Names(alphabetically).
To search for specific names, choose View > Find to open the Find dialog box. Enter the search string in the text field and click Apply.
The Cumulative Display
The Cumulative display (see Figure 2-7) shows the total execution time spent by a function, file, or load object, including time spent in called functions, files, or segments. All execution time accumulated in a descendant function is attributed to the parent function.
The Cumulative display is available for the following data types:
-
User Time
-
System Wait Time
-
System Time
-
Text Page Fault Time
-
Data Page Fault Time
Figure 2-7 Cumulative Display
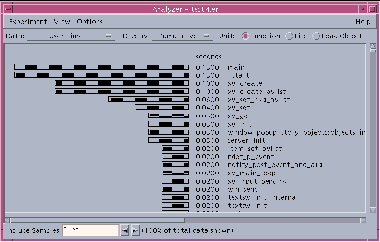
To view data at various levels of compilation granularity, choose one of the following unit types:
| Function | Time your application spent executing functions |
| File | Time spent executing file-level units. This view is useful if your application has a large number of functions. All data for a single source file is displayed together. Note: If any part of the executable (including shared libraries) is not compiled with the -g option, the Sampling Collector may not have enough information to associate functions with their containing files. |
| Load Object | Time spent executing text segments. |
You can select which samples to include in the Cumulative display in three ways:
-
Type sample numbers directly into the Includes Samples text field: separate numbers with commas (1,3,6), and define ranges using a hyphen (1-6).
-
Select the columns containing those samples while still in the Overview display.
-
Choose either View > Select or View > Select None while still in the Overview display to include or exclude all samples in the experiment.
To select which segments to include in the Cumulative display, choose View > Segments Included from Files to open the Segments Included from Files dialog. Click any segments and click Apply, or click the Select All button to select all segments.
To sort the Cumulative display, choose View > Sort by and select either Values (descending by time value) or Names (alphabetically).
To search for specific names, choose View > Find to open the Find dialog box. Enter the search string in the text field and click Apply.
The Address Space Display
The Address Space display (see Figure 2-8) helps you identify memory that is most heavily used by your application (modified and referenced pages). This display option also identifies memory that is unused because the experiment did not exercise all of your application's functionality, or because your application has dead code or memory allocation problems.
The Address Space display option shows data only if you collect address-space data. If no address-space data was collected, a message to that effect will appear at the bottom of the Sampling Analyzer screen.
Memory Categories
The Address Space display divides memory used by your application into the following categories:
| Modified | A page written on during the execution of the application; may or may not be referenced |
| Referenced | A page read by your application or containing instructions that have been executed by your application |
| Unreferenced | A page neither modified nor referenced by the application |
Address Space Display Layout
The Address Space display (see Figure 2-8) is laid out in rows and columns that are made up of individual squares (pages) or rectangles (segments). The rows and columns are numbered to describe their address in memory. Gaps (shown as white space) represent a region of the address space that was not used by the application.
Figure 2-8 Address Space Display
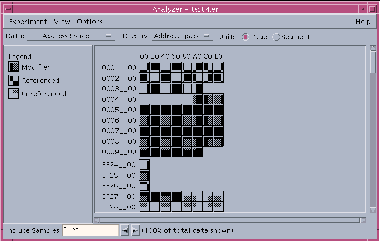
Sun systems use either 4-Kbyte or 8-Kbyte pages. The address of a page is a multiple of 0x1000 (4 Kbytes in hexadecimal) or 0x2000 (8 Kbytes in hexadecimal).
To verify the page size of your system, go to a prompt and type:
% pagesize
The pagesize command returns the page size in bytes:
-
4096 (4-Kbyte pages)
-
8192 (8-Kbyte pages)
If the page size is 4 Kbytes, the number of pages per row is 16. If the page size is 8 Kbytes, the number of pages per row is 8.
You can determine the address of a page by combining the hexadecimal values of the row and column that contains the page. For example, if the page you are examining is in the fourth row (0004_ _00) and the third column (20), then the address of that page is 00042000.
To view memory units at various levels of granularity in the Address Space display, select Page or Segment in the Unit type area.
Selected pages and segments are shadowed and raised to the left. If you keep the right mouse button pressed down over a selected page, the segment containing that page is also displayed and shadowed; likewise, if you keep the right mouse button pressed down over a selected segment, the pages contained within that segment are also displayed and selected.
To view information about the properties of a selected page or segment, choose View Show Details to open either the Page Properties or Segment Properties dialog, which displays the following information:
-
Address
-
Size of the page or size range of the segment in bytes
-
Functions contained in the page or segment
-
Name of the segment
To select which samples to include in the Address Space display, you can:
-
Type sample numbers directly into the Includes Samples text field: separate numbers with commas (1,3,6), and define ranges using a hyphen (1-6).
-
Select the columns containing those samples while still in the Overview display.
-
Choose either View Select or View Select None while still in the Overview display to include or exclude all samples in the experiment.
The Statistics Display
The Statistics display (see Figure 2-9) provides data about your application's overall performance and system resource usage (as opposed to the Histogram, Cumulative, and Address Space display options, which show data broken down by program components such as functions and pages). The information provided by the Statistics display is useful when you want to compare actual numerical values against any previous estimates you may have made.
Figure 2-9 Display of Program Execution Statistics
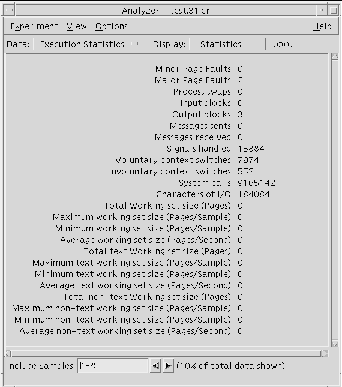
The information needed to produce the Statistics display is always collected by the Sampling Collector during the data collection process, so you do not need to specify any particular data type to view information in this display. The Statistics display shows:
| Minor Page Faults | The number of page faults serviced that do not require any physical I/O activity |
| Major Page Faults | The number of page faults serviced that require physical I/O activity (if non-zero, the Overview display shows text page or data page fault wait time) |
| Process swaps | The number of times a process is swapped out of main memory |
| Input blocks | The number of times a read() system call is performed on a non-character or special file |
| Output blocks | The number of times a write() system call is performed on a non-character or special file |
| Messages sent | The number of messages sent over sockets |
| Messages received | The number of messages received from sockets |
| Signals handled | The number of signals delivered or received |
| Voluntary context switches | The number of times a context switch occurred because a process voluntarily gave up the processor before its allotted time was completed, to wait for availability of a resource |
| Involuntary context switches | The number of times a context switch occurred because a higher-priority process became runnable, or because the current process exceeded its allotted time |
| System calls | The total number of system calls |
| Characters of I/O | The number of characters transferred in or out to a character device or file by read and write calls |
| Total address space size | Total size of the address space (in pages) |
| Maximum address space size | Maximum size of the address space (pages per sample) |
| Minimum address space size | Minimum size of the address space (pages per sample) |
| Average address space size | Average size of the address space (pages per sample) |
| Total text address space size | Total size of the text address space (pages) |
| Maximum text address space size | Maximum size of the text address space (pages per sample) |
| Minimum text address space size | Minimum size of the text address space (pages per sample) |
| Average text address space size | Average size of the text address space (pages per sample) |
| Total non-text address space size | Total size of the non-text address space (pages) |
| Maximum non-text address space size | Maximum size of the non-text address space (pages per sample) |
| Minimum non--text address space size | Minimum size of the non-text address space (pages per sample) |
| Average non-text address space size | Average size of the non-text address space (pages per sample) |
Note -
Workset sizes will be non-zero only if address-space data was collected.
You can select which samples to include in the Statistics display in three ways:
-
Type sample numbers directly into the Includes Samples text field: separate numbers with commas (1,3,6), and define ranges using a hyphen (1-6).
-
Select the columns containing those samples while still in the Overview display.
-
Choose either View Select or View Select None while still in the Overview display to include or exclude all samples in the experiment.
- © 2010, Oracle Corporation and/or its affiliates
