Comparing the Data
You can compare a variable or expression whose values have been saved in a file with another version of the variable or expression. This comparison could take place later in the same run of the program, during a subsequent run, or even during a second, simultaneous Prism session.
You can also compare the values with those of another variable, as long as both variables have the same base type (that is, you can't compare integers with floating-point numbers).
From the Command Line
You can use the print or display command with the difference operator and the varfile intrinsic to perform a comparison between two versions of a variable or expression.
For example, if you saved x in the file x.var:
varsave "x.var" x
then the command
print x - varfile("x.var")
prints the difference between the current and saved values of x.
If an element is printed as 0, it is the same in both versions. If it is nonzero, its value is different in the two versions.
From a Visualizer
Use the Diff or Diff With selection from a visualizer's File menu to compare the visualizer's values with values stored in a file.
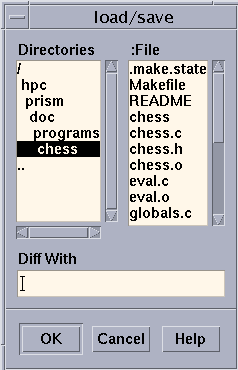
Choose Diff With to choose the file containing the values. It displays a dialog box like the one shown below.
Figure 5-16 Diff With Dialog Box

The dialog box has the same format as the Save As dialog box described in " Saving the Values of a Variable". It lists the files found in your current working directory in Prism. Click on a file name, then click on OK to choose the file. Or type a file name in the Diff With text-entry box and click on OK.
Choose Diff to compare the visualizers values to those in the most recently specified file; if no file has been specified, values are compared to those in the file noname.var in your current working directory in Prism.
Once you have specified a file via Diff or Diff With, Prism creates a new visualizer that displays the difference in values between the visualizer and the file. If an element's value in the new visualizer is 0, the value is the same in both versions. If it is nonzero, it is different in the two versions.
You can work with this visualizer as you would any visualizer. For example, you can change the representation and display summary statistics.
- © 2010, Oracle Corporation and/or its affiliates
