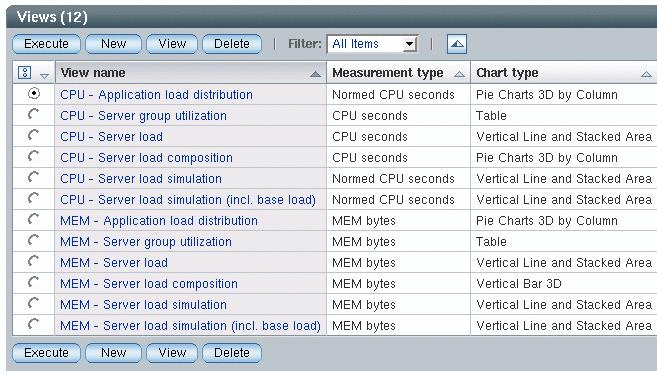
Views
Overview
Once performance data (CPU and memory consumption of every component on every host of the N1 AA Landscape) are imported into the database, you can use MDX queries in the N1 AA Analyzer for reporting and graphical illustration.
You can use the predefined MDX queries delivered along with N1 AA, but you can also write your own queries.
- Purpose
-
Reporting and graphical illustration of resource consumption. Capacity planing. Create, modify or extend reporting functionalities (MDX queries).
- Menu
-
Server group⇒ Analyzer ⇒ Views
- Use case
-
Daily business
Figure 3–5 Views

MDX Queries
MDX is an abbreviation for Multi-Dimensional Expressions. This is a joint specification of the XML for Analysis founding members. MDX was created to query OLAP databases. MDX has become widely adopted within the realm of analytical applications.
To learn more about MDX, visit the Mondrian OLAP server home page at http://mondrian.sf.net. They have a comprehensive MDX specification including examples on how to write MDX queries.
Predefined MDX Queries
The N1 AA Analyzer comes with some predefined MDX queries allowing you to perform the most common analyses on your system landscape.
Note –
These queries are read-only, you can neither modify nor delete them. These queries are available in every server group.
Table 3–3 MDX Queries
|
View name |
Description |
Benefits |
|---|---|---|
|
CPU - Server group utilization |
Get a CPU utilization overview of your server group. Key utilization values are displayed and the load is qualified. The qualification itself is based on threshold values that are customizable in the N1 AA. See Basic Setup. Note – Find details of this query and especially the meaning of the customizable parameters in the Appendix A, MDX Queries. Input/Usage
|
Quickly identify CPU bottlenecks or oversupply. |
|
MEM - Server group utilization |
Get a memory utilization overview of your server group. Key utilization values are displayed and the load is qualified. The qualification itself is based on threshold values, that are customizable. See Basic Setup. Note – Find details of this query and especially the meaning of the customizable parameters in the Appendix A, MDX Queries. Input/Usage
|
Quickly identify memory bottlenecks or oversupply. |
|
CPU - Application load distribution |
CPU consumptions of all components belonging to the specified application are displayed in relation to each other. Data basis are the normalized CPU seconds in the specified time frame. Input/Usage
|
Find the main CPU consuming components of an application. |
|
MEM - Application load distribution |
Memory consumptions of all components belonging to the specified application are displayed in relation to each other. Input/Usage
|
Find the main memory consuming components of an application. |
|
CPU - Server load |
Display the used CPU seconds of every component along the specified timeline. Input/Usage
|
Find the CPU capacity situation on the server. |
|
MEM - Server load |
Display the used memory of every component along the specified timeline. Input/Usage
|
Find the memory capacity situation on the server. |
|
CPU - Server load composition |
CPU consumptions of all components running on the specified host are displayed in relation to each other. Data basis are the CPU seconds in the specified time frame. Input/Usage
|
Find the main CPU consuming components running on the server. |
|
MEM - Server load composition |
Average memory consumption, in bytes, of all components running on the specified host are displayed. The None.Free value represents the free physical memory capacity and can be negative. Input/Usage
|
Find the main memory consuming components running on the server. |
|
CPU - Server load simulation |
What-If Analysis: Simulates the consolidation of application components on a target server. The output graphic displays the resulting CPU utilization on that server. The available server capacity is displayed as a horizontal line. All are based on the normalized CPU consumptions. Input/Usage
|
Reduce Risk: Simulate capacity situation before application consolidation. |
|
MEM - Server load simulation |
What-If Analysis: Simulates the consolidation of application components on a target server. The output graphic displays the resulting memory utilization on that server. The available server capacity is displayed as a horizontal line. All are based on the measured memory consumptions. Input/Usage
|
Reduce Risk: Simulate capacity situation before application consolidation. |
|
CPU - Server load simulation (incl. base load) |
Same as CPU – Server load simulation. The difference being that all component loads of application Noneexcept the None.Free value are left on the selected target server as some kind of base CPU consumption. Input/Usage
|
Reduce Risk: Simulate capacity situation before application consolidation. |
|
MEM - Server load simulation (incl. base load) |
Same as MEM – Server load simulation. The difference being that all component loads of application None except the None.Free value are left on the selected target host as some kind of base memory consumption. Input/Usage
|
Reduce Risk: Simulate capacity situation before application consolidation. |
Create Your Own MDX Queries
You can create and modify your own MDX queries. See Appendix A, MDX Queries for detailed information.
- © 2010, Oracle Corporation and/or its affiliates
