N1 AA Analyzer: Create Your Own MDX Queries
This section describes how to create your own MDX queries.
Note –
Created MDX queries are available within the server group only.
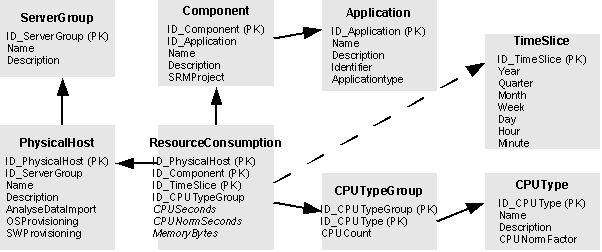
These MDX queries are based on the underlying database model. The following picture gives an overview on this model. The fields in cursive letters will be available as measurands for your MDX Queries within the cube.
Figure A–3 Overview of MDX Queries

Every measurand taken by the Performance Collector on an N1 AA Client leads to a set of self-contained entries in the Resource Consumption table. The measurand is taken every 15 minutes. Each of these entries describes the resource consumption of exactly one measured application component at the given point in time.
Table A–2 Resource Consumption|
ID_PhysicalHost |
ID_Component |
ID_TimeSlice |
ID_CPUTypeGroup |
CPUSeconds |
CPUNormSeconds |
MemoryBytes |
|---|---|---|---|---|---|---|
|
1 |
6 |
2006-01-01 00:30:00 |
1 |
0.83 |
1.66 |
105553920 |
|
1 |
4 |
2006-01-01 00:30:00 |
1 |
157.87 |
315.74 |
177684480 |
|
1 |
3 |
2006-01-01 00:30:00 |
1 |
48.86 |
97.72 |
703455232 |
|
1 |
22 |
2006-01-01 00:30:00 |
1 |
10.41 |
20.82 |
4481024 |
|
1 |
5 |
2006-01-01 00:30:00 |
1 |
9.30 |
18.60 |
0 |
|
1 |
1 |
2006-01-01 00:30:00 |
1 |
658.00 |
1316.00 |
–655630336 |
|
1 |
2 |
2006-01-01 00:30:00 |
1 |
14.73 |
29.46 |
0 |
(with ID_Component 1 = Free; 2 = Other; 3 = SAP-D01-CI; 4 = SAP-D01-DB; 5 = user.root; 6 = system; 22 = SAP-E01-D05)
In this example, component #3, which is SAP-D01-CI, has used 48.86 CPU seconds within the 15–minute interval and the memory consumption was 703455232 bytes.
-
The CPUSeconds represent the utilized CPU seconds of the application component within the fixed measurement interval of 15 minutes. In the same way CPUNormSeconds represent the normalized utilization.
-
MemoryBytes represent the utilized memory allocation of the application component, which is a snapshot at the end of the measurement interval.
-
You always find an entry for the application component Free, that represents the unused resource capacity on the host (free memory, unused CPU seconds). In the case of memory, this value can be negative.
-
You always find an entry for the application component Other, that represents the resource consumptions that could not be assigned to any SRM Project.
-
The sum of all entries represents the servers capacity at the given point in time. For example, the sum of MemoryBytes give the available RAM capacity.
In addition to the MDX keywords, the following N1 AA Analyzer specific placeholders were introduced:
Table A–3 Analyzer Placeholders|
Placeholder |
Description |
|---|---|
|
[$ServerGroup] |
Constant member set of ServerGroup dimension containing a single member, equals the actual server group at runtime. |
|
[$PhysicalHost] |
Variable member set of ServerGroup dimension and PhysicalHost hierarchy, equals the selected set of physical hosts at runtime. Using this placeholder will enable the Physical hosts section in selection screen when executing an analysis. |
|
[$Application] |
Variable member set of Application dimension, equals the selected set of applications at runtime. Using this placeholder will enable the Applications section in selection screen when executing an analysis. |
|
[$Component] |
Variable member set of Application dimension and Component hierarchy, equals the selected set of components at runtime. Using this placeholder will enable the Components section in selection screen when executing an analysis. |
|
[$Consumptions] |
Variable member set as cross product of ServerGroup dimension and PhysicalHost hierarchy and Application dimension and Component hierarchy, equals the selected set of consumptions. Each happened on a dedicated physical host by a dedicated component. Using this placeholder will enable the Dedicated consumptions section in selection screen when executing an analysis. |
|
[$TimeSlice_Minute] |
Variable member set of TimeSlice dimension, equals the selected timeframe at runtime on a minute-based resolution. Using this placeholder will enable the Timeframe section in selection screen when executing an analysis. All time entries are represented in the UTC time zone when displaying analysis results in tables or diagrams. |
|
[$TimeSlice_Hour] |
Same as above, on a hour-based resolution (termed: aggregation). |
|
[$TimeSlice_Day] |
Same as above, on a day-based resolution (termed: aggregation). |
|
[$TimeSlice_Week] |
Same as above, on a week-based resolution (termed: aggregation). |
|
[$TimeSlice_Month] |
Same as above, on a month-based resolution (termed: aggregation). |
|
[$TimeSlice_Quarter] |
Same as above, on a quarter-based resolution (termed: aggregation). |
|
[$TimeSlice_Year] |
Same as above, on a hour-based resolution (termed: aggregation). |
|
[$TimeSlice] |
Same as [$TimeSlice_Minute], but in dispose of raw times written by the Performance Collector daemon. Note – Do not use this placeholder. All time entries in analysis results will be 15 minutes late. |
|
[$constantname] |
Constant that is replaced with the value maintained in Analyzer Customizing. See Basic Setup. The value will be taken from parameter none.analyzer.constants.constantname. Within a dedicated server group, the value will be overwritten by parameter servergroup.analyzer.constants.constantname only if this parameter is maintained, which is optional. |
- © 2010, Oracle Corporation and/or its affiliates
