About the BPEL Monitoring Console
The BPEL Monitoring Console monitors your BPEL Service Engine's applications and business processes, allowing you to quickly discern the health of your system. The console is designed to provide a comprehensive view of your current applications. It provides a real time representation of your business processes throughout the life cycle of each instance. The console also enables you to drill down to see what is happening with any specific application or process. It allows you to track down a business process based on customer information and to suspend and resume an instance for system maintenance.
The BPEL Monitoring Console runs as an independent web application and can run from a remote computer. The console runs on the GlassFish server in a GlassFish ESB environment. The console is designed to provide maximum responsiveness and uses Ajax to ensure that you see each point in process as it happens.
Note –
Currently, the console does not work in a clustered environment.
The main pages of the BPEL Monitoring Console are:
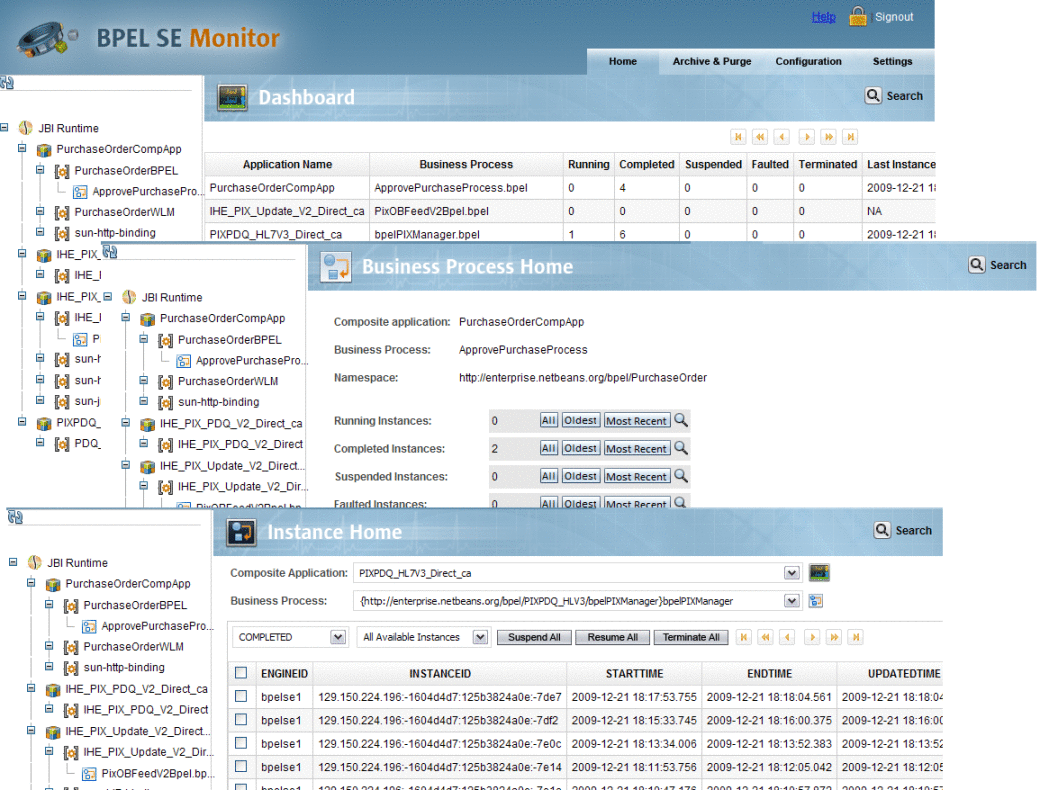
The Dashboard
The BPEL Monitoring Console starts with the Dashboard, a top-level window that provides a holistic picture of all your deployed applications.
From the Dashboard you can see:
-
Which processes are running
-
The number of process instances that have completed, faulted, or have been suspended, or terminated
-
The time at which the most recent business process instance occurred
-
The Instance Processing Rate or number of instances for a specified period

The Business Process Home Page
The Business Process Home displays statistical information for the selected business process, similar to the Dashboard. In addition, the Business Process Home provides a graphical model of the business process, as well as a textual display of the business process code for an even finer level of information. From this window, you can drill down into instance information for all instances, oldest instances, or most current instances.
The Instance Home Page
On the Instance Home you can view a group of business process instances or select a specific instance.
From the Instance Home you can:
-
View all completed, suspended, or terminated business process instances
-
Choose specific instances to view, from the oldest to the most recent
-
View the Service Engine, instance ID, start, end, updated time, and status for an instance
-
Look at the life cycle of an instance in real time
-
View the variables for the instance
-
Click on a process instance to display a Process Scalable Vector Graphic (SVG) model of the instance in the real-time current state of execution
-
Suspend, resume, or terminate one or all instances for maintenance or customer service
- © 2010, Oracle Corporation and/or its affiliates
