2.3.2 Data Races in pthr_prime.c
% cc pthr_prime.c -lm -mt -xinstrument=datarace                                 .
% collect -r on a.out | sort -n

Creating experiment database test.2.er ...
of type "nfs", which may distort the measured performance.
0
0
0
0
0
0
0
0
0
0
...
0
0
Creating experiment database test.2.er ...
Number of prime numbers between 2 and 3000: 328
751
757
761
773
797
809
811
821
823
827
829
839
853
857
859
877
881
883
887
907
...
2999
2999

% er_print test.2.er
(er_print) races

Total Races:  6 Experiment:  test.2.er

Race #1, Vaddr: 0x218d0
      Access 1: Write, work + 0x00000154,
                       line 40 in "pthr_prime.c"
      Access 2: Write, work + 0x00000154,
                       line 40 in "pthr_prime.c"
  Total Traces: 3

Race #2, Vaddr: 0x218d0
      Access 1: Read,  work + 0x000000CC,
                       line 39 in "pthr_prime.c"
      Access 2: Write, work + 0x00000154,
                       line 40 in "pthr_prime.c"
  Total Traces: 3

Race #3, Vaddr: 0xffbfeec4
      Access 1: Write, main + 0x00000204,
                       line 55 in "pthr_prime.c"
      Access 2: Read,  work + 0x00000024,
                       line 35 in "pthr_prime.c"
  Total Traces: 2

Race #4, Vaddr: (Multiple Addresses)
      Access 1: Write, work + 0x00000108,
                       line 39 in "pthr_prime.c"
      Access 2: Write, work + 0x00000108,
                       line 39 in "pthr_prime.c"
  Total Traces: 1

Race #5, Vaddr: 0x23bfc
      Access 1: Write, is_prime + 0x00000210,
                       line 22 in "pthr_prime.c"
      Access 2: Write, is_prime + 0x00000210,
                       line 22 in "pthr_prime.c"
  Total Traces: 1

Race #6, Vaddr: 0x247bc
      Access 1: Write, work + 0x00000108,
                       line 39 in "pthr_prime.c"
      Access 2: Read,  main + 0x00000394,
                       line 65 in "pthr_prime.c"
  Total Traces: 1
(er_print)
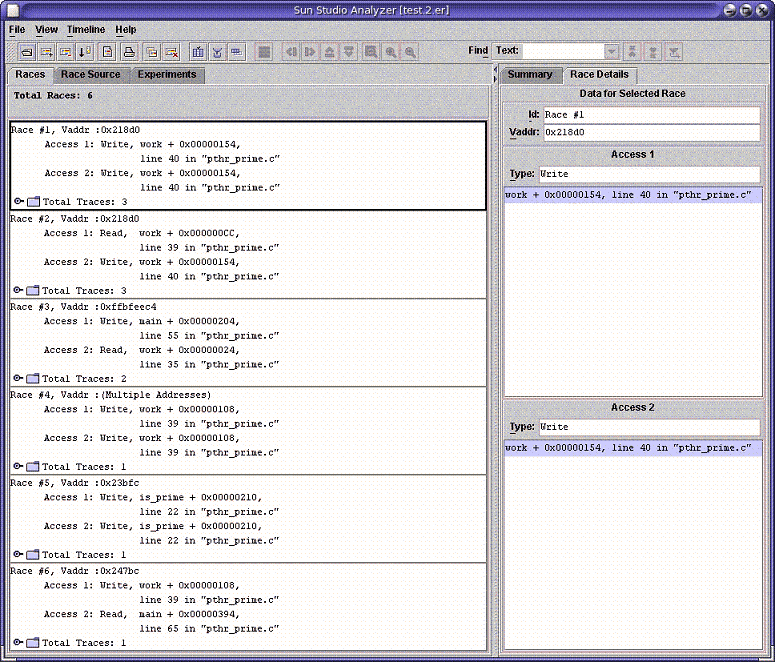
The following screen-shot shows the races detected in pthr_primes.c as displayed by the Thread Analyzer GUI. The command to invoke the GUI and load the experiment data is tha test.2.er.
Figure 2–2 Data Races Detected in pthr_primes.c

There are six data-races in pthr_prime.c:
-
Race number one: A data-race between a write to total on line 40 and another write to total on the same line.
-
Race number two: A data-race between a read from total on line 39 and a write to total on line 40.
-
Race number three: A data-race between a write to i on line 55 and a read from i on line 35.
-
Race number four: A data-race between a write to
primes[]on line 39 and another write toprimes[]the same line. -
Race number five: A data-race between a write to
pflag[]on line 22 and another write topflag[]on the same line -
Race number six: A data-race between a write to
primes[]on line 39 and a read fromprimes[]on line 65.
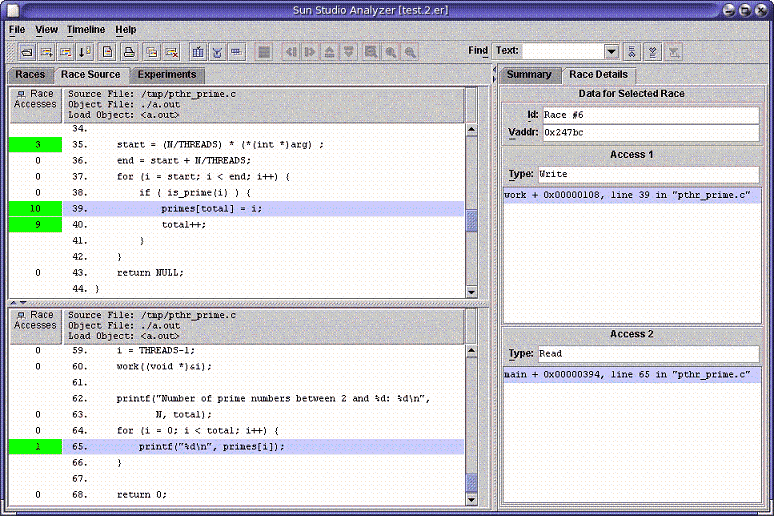
One advantage of the GUI is that it allows you to see, side by side, the two source locations associated with a data-race. For example, select race number six for pthr_prime.c in the Races tab and then click on the Dual Source tab. You will see the following:
Figure 2–3 Source-Location Details of a Data Race

The first access for race number six (line 39) is shown in the top Race Source pane, while the second access for that data-race is shown in the bottom pane. Source lines 39 and 65, where the data-race accesses occurred, are highlighted. The default metric (Exclusive Race Accesses metric) is shown to the left of each source line. This metric gives a count of the number of times a data-race access was reported on that line.
- © 2010, Oracle Corporation and/or its affiliates
