Profiling Where the Processor Events Occur
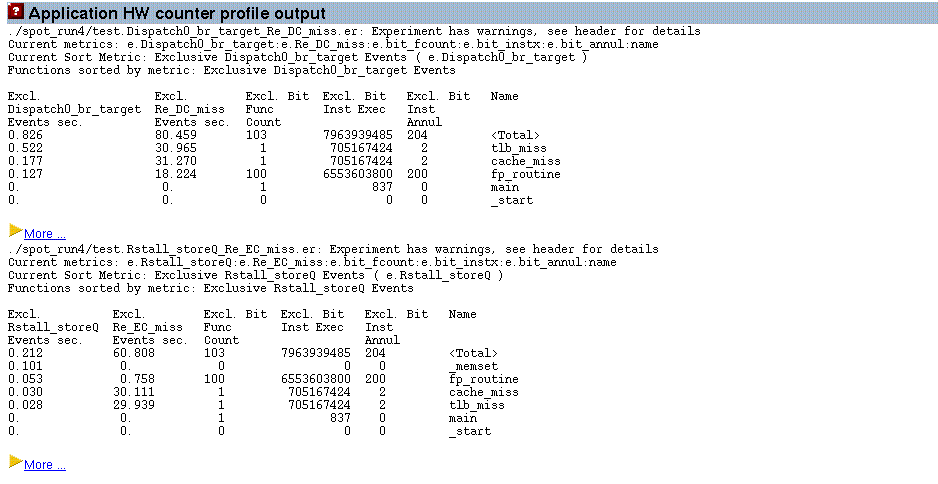
If extended information is requested by specifying the -X flag, then the SPOT software will profile the application using the performance counters that contribute most stall time to the run of the application. This generates several profiles of the application which indicate exactly where in the code the events are occurring. Figure 3–10 shows the summary that is presented on the SPOT report.
Figure 3–10 Application Hardware Counter Profile

Following the More hyperlinks on this page will take you to a more detailed display of source code (if the application was compiled with -g and the source code is accessible) and disassembly code.
From the results shown in Figure 3–10 it is apparent that the External Cache (EC) misses are mainly attributed to the cache_miss and tlb_miss routines.
- © 2010, Oracle Corporation and/or its affiliates
