Chapter 10 System Maintenance
Maintaining a running implementation of Web Space Server Portal is not much different from maintaining the application server environment upon which it is running. There are, however, several factors which administrators should be aware of when they are responsible for a running instance of Web Space Server. This chapter covers these issues, outlining for system administrators some specifics about keeping a running Web Space Server instance stable and secure.
Following are the sections explained in this chapter:
The discussion on back up will cover what parts of Web Space Server should be backed up. Specific backup software or procedures are not covered because generally, most organizations have standards for doing backups of their systems, and Web Space Server as a Java EE application fits well into these standards.
Web Space Server Monitoring using Google Analytics
Web Space Server includes built-in support for Google Analytics, allowing administrators to make use of Google's tool set for analyzing site traffic data. When you sign up for Google Analytics, a snippet of code is provided which needs to be added to your web pages in order to allow Google's system to register the page hit. It can be a tedious process to add this code to every page on a site, especially if it is a large site and there is a lot of user-generated content.
This problem can be solved in Liferay by putting Google's code into a custom theme written especially for the site on which the portal is running. Doing this, however, requires that a theme developer make specific changes to the theme, and it prevents users from using the many freely available themes that are available for Web Space Server 'out of the box'.
Because of this, support for Google Analytics has been built into Web Space Server, and can be turned on through a simple user interface. This allows Web Space Server Administrators to make use of Google Analytics on a community by community basis and turn it on and off when needed.
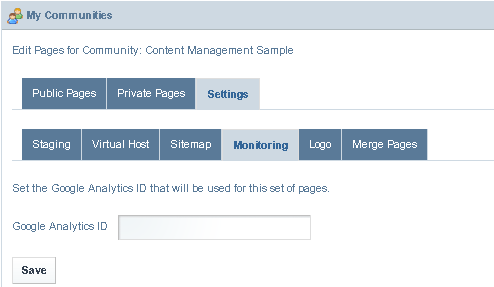
To enable Google Analytics support, go to the Manage Pages screen for the community for which you want to enable support. You can do this through the Communities portlet or by choosing the Manage Pages from the Welcome menuwhile you are on a page in the community. Select Monitoring under Settings.
Figure 10–1 Monitoring Using Google Analytics

To enable Google Analytics support, go to the Manage Pages screen for the community for which you want to enable support. You can do this through the Communities portlet or by clicking the Manage Pages link in the Dock while you are on a page in the community.
Backing Up a Web Space Server Installation
Once you have an installation of Web Space Server Portal running, you will want to have proper backup procedures in place in case of a catastrophic failure of some kind. Web Space Server is not very different from any other application that may be running in your application server, but there are some specific components that need to be backed up in addition to your regular backup procedures for your application server.
Source Code
If you have extended Web Space Server or have written portlet or theme plugins, they should be stored in a source code repository such as Subversion, CVS, or Git. This repository should be backed up on a regular basis to preserve your ongoing work.
If you are extending Web Space Server with the Extension Environment, you will want to make sure that you also store the version of the Web Space Server source on which your extension environment is based. This allows your developers convenient access to all of the tools they need to build your extension and deploy it to a server.
Web Space Server's File System
Web Space Server's configuration file, portal-ext.properties, gets stored in the WEB-INF/classes folder in the location to which your application server deployed Web Space Server. At a minimum, this file should be backed up, but it is generally best to back up your whole application server.
Web Space Server also stores configuration files, search indexes, cache information, and the default Jackrabbit document repository in a folder called webspace in the domain directory of the application server. You need to backup this folder.
Database
Web Space Server's database is the central repository for all of the Portal's information and is the most important component which needs to be backed up. You can do this by either backing up the database live (if your database allows this) or by exporting the database and then backing up the exported file. For example, MySQL ships with a mysqldump utility which allows you to export the entire database and data into a large SQL file. This file can then be backed up. In case of a database failure, it can be used to recreate the state of the database at the time the dump was created.
You can use the Oracle dump feature for backup and restore of Oracle database. See, http://www.orafaq.com/wiki/Import_Export_FAQ.
If you are using Web Space Server's Document Library extensively, it is likely that you have configured Jackrabbit to store documents in a database rather than the file system. In this case, the Jackrabbit database should be backed up also.
Monitoring and Logging
The admin user need to access Control Panel -> Server -> Server Administration for monitoring and logging in Sun GlassFish Web Space Server.
Monitoring in Sun GlassFish Web Space Server
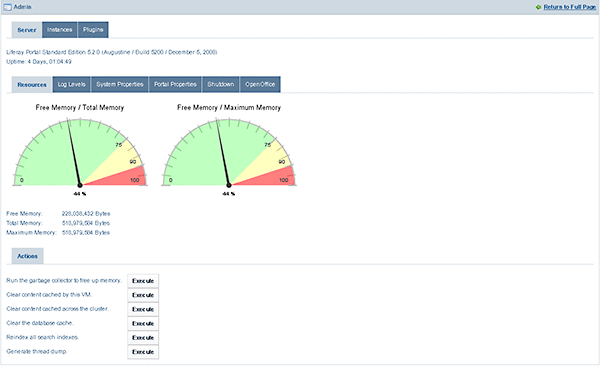
Sign in to Web Space Server as admin user, and navigate to Control Panel -> Server -> Server Administration from the Welcome menu.
Figure 10–2 Monitoring of Resources

You can execute a resource maintenance action by selecting the Execute button next to any option in the following list of actions. You can execute the following actions:
- Run the garbage collector to free up memory
-
Garbage collection frees memory occupied by unused objects. Click the Execute buttonnext to the Run the garbage collector to free up memory option. It increases the 'Free Memory' considerably.
- Clear content cached by this VM
-
The Virtual Machine identifies the web page responses that are the same for each request and to remember (cache) the content. In some cases it can be useful to clear this cache to free the memory.
- Clear content cached across the cluster
-
Executing this action clears the cluster cache.
- Clear the database cache
-
Executing this action clears the database cache.
- Reindex all search indexes
-
Executing this action removes all old search entries.
- Generate thread dump
-
When the application server freezes or hangs or becomes sluggish for no apparent reason, it is recommended to generate a thread dump. Executing this action generates a thread dump.
Logging in Sun GlassFish Web Space Server
Web Space Server uses Log4j extensively to implement logging for nearly every class in the portal. If you need to debug something specific while a system is running, you can use the Admin portlet to set logging levels by class dynamically.
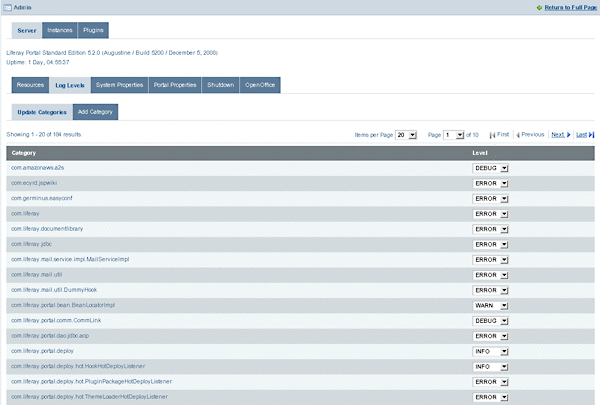
Sign in to Web Space Server as admin user, and navigate to Control Panel -> Server -> Server Administration from the Welcome menu. Sign in as admin user to access the Admin portlet. To view the log levels, select the Log Levels tab.
You will then see a paginated list of logging categories. You can select a logging level for a category from the list. If the logging level is set to ERROR, an error message is displayed if an error occurs in the class. Similarly, if the logging level is set to WARN, an error message is displayed if a warning occurs in the class. OFF, FATAL, ERROR, WARN, INFO, DEBUG, and ALL are the different logging levels.
Each category is filtered by its place in the class hierarchy. For example, if you wanted to see logging for a specific class that is registered in the Admin portlet, you would browse to that specific class and change its log level to something that is more descriptive, such as DEBUG. Once you click the Save button at the bottom of the list, you will start seeing DEBUG messages from that class in your application server's log file.
If you are not sure which class you want to see log messages for, you can find a place higher up in the hierarchy and select the package name instead of an individual class name. If you do this, messages for every class lower in the hierarchy will be displayed in your application server's log file.
Be careful when you do this. If you set the log level to DEBUG somewhere near the top of the hierarchy (such as com.liferay, for example), you may wind up with a lot of messages in your log file. This could make it difficult to find the one you were looking for, and causes the server to do more work writing messages to its log file.
Figure 10–3 Changing the Logging Level

If you are working in the extension environment or have created a plugin and want to set the log level for one of your own classes, you can register that class (so long as it uses Log4J to do its logging) with the Admin portlet so that you can control the log levels more easily.
You will first need to implement Log4J logging in your class, with a statement such as the following (taken from Liferay's JCRHook class):
private static Log _log = LogFactory.getLog(JCRHook.class);
You would then use this _log variable to create log messages in your code for the various logging levels:
_log.error("Reindexing " + node.getName(), e1);
To enable your logging messages to appear in your server's log file via the Admin portlet, click the Add Category tab on the same Log Levels page.
Figure 10–4 Adding a Logging Category

You will see that you can add a logging category to the Admin portlet. Simply put in the fully qualified name of your class or of the package that contains the classes whose log messages you want to view, choose a log level, and then click the Save button. You will now start to see log messages from your own class or classes in the server's log file.
- © 2010, Oracle Corporation and/or its affiliates
