A Brief Tour of Performance Monitor 1.0
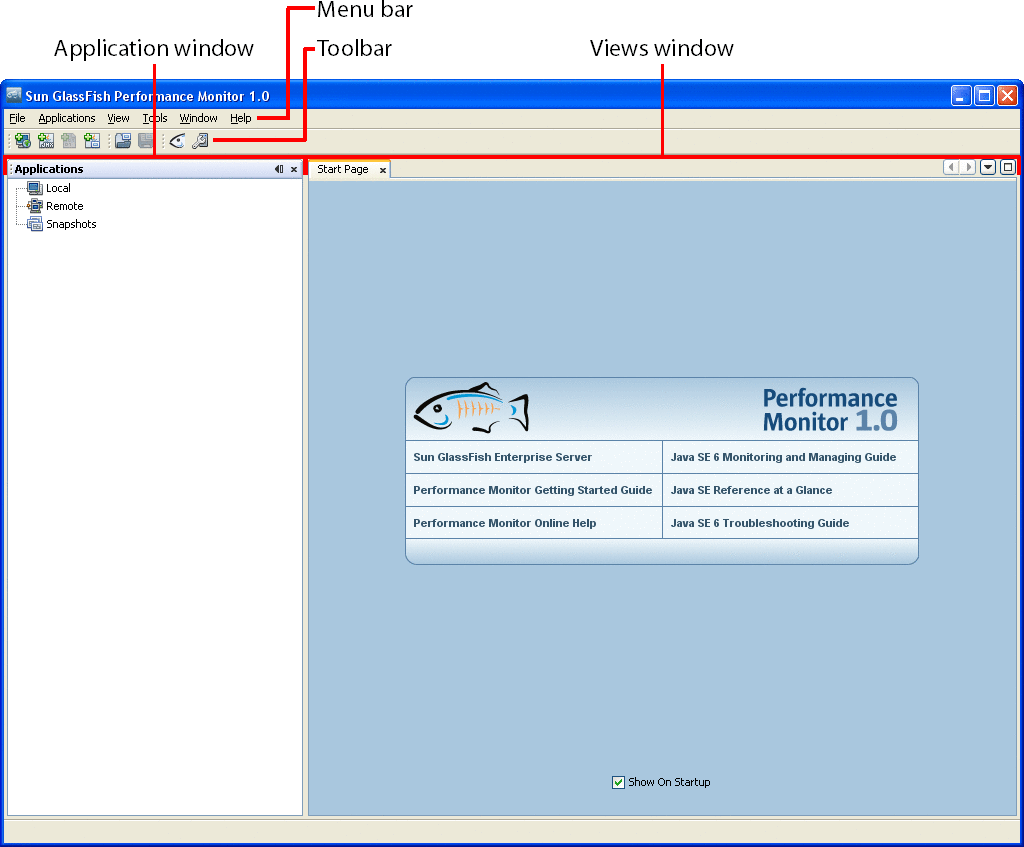
Performance Monitor 1.0 provides a graphical interface that is simple and familiar to users of graphical desktop systems.

The menu bar and taskbar appear across the top of the window, and the remainder of the window is divided into two areas: the applications window on the left and the views window on the right.
The Menu Bar
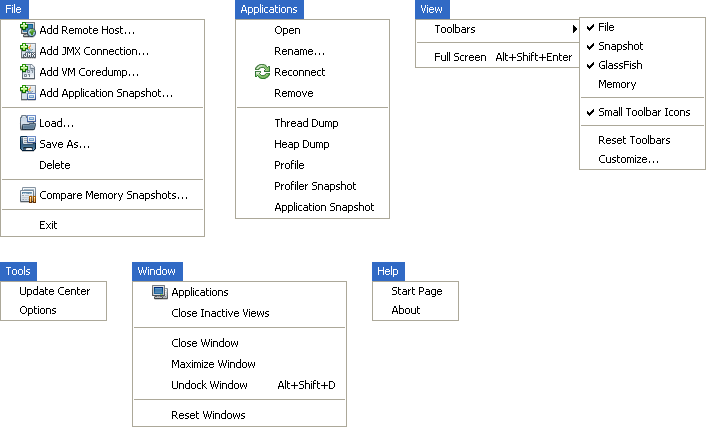
The menu bar provides six menus:

Most of these menus and menu items are self-explanatory. However, a few of them are worth highlighting:
-
File > Add Remote Host is the command to add a remote host under the Remote node of the Applications window.
-
File > Add JMX Connection is the command to add a JMX connection to a GlassFish domain running on a remote host under the Remote node of the Application window.
-
Tools > Options displays the Options window, where you can change various polling, caching, and charting values.
-
Help > About displays information about brief information about Performance Monitor, but it also provides Details and Logfile buttons to get more detailed information.
The Toolbar
The toolbar provides quick access to commonly used commands, and is customizable using the View > Toolbars > Customize command. By default, Performance Monitor displays three toolbars:
-
File, which provides quick access to these File menu commands:
-
Add Remote Host
-
Add JMX Connection
-
Add VM Coredump
-
Add Application Snapshot
-
-
Snapshot, which provides quick access to these File menu commands:
-
Load
-
Save As
-
-
GlassFish, which provides two special commands:
-
 Show All Java VMs, which controls whether only GlassFish
VMs or all VMs on the local system are displayed under the Local node in the
Applications window.
 -
 Show System VMs, which controls whether VMs for system
applications are displayed in the Applications window.
-
Performance Monitor provides a fourth default toolbar, Memory, which displays memory usage by Performance Monitor.
The Applications Window
The Applications window displays a tree outline of the items you are monitoring or can connect to a monitor. The tree outline has four main branches, or nodes:
-
Local, which contains GlassFish domains, GlassFish instances, and other VMs on the local system.
-
Remote, which contains connections to remote servers (and the GlassFish resources they host).
-
VM Coredumps, which contains any VM coredumps loaded into Performance Monitor.
-
Snapshots, which contains any application or profiler snapshots loaded into Performance Monitor.
For details about the items that can navigate to in the Applications windows, see the online help for Performance Monitor, available at http://wikis.sun.com/display/PerfMonitorOLH.
The Views Window
The views windows displays the views, or performance metrics information, for items you are monitoring. To display the view for an item, double-click it in the Applications window.
If you have opened views on multiple items, the views are listed in tabs across the top of the views window.
For details about the view (and the performance metrics) Prformance Monitor provides for each type of item, see the online help for Performance Monitor, available at http://wikis.sun.com/display/PerfMonitorOLH.
- © 2010, Oracle Corporation and/or its affiliates
