Choosing How the Parameters Are Displayed
You can arrange the Performance Meter window in different ways, depending on the number of parameters you have chosen to display, the space available on your desktop, and whether you want to display historical values.
Figure 18-1 Performance Meter Displaying All Parameters

To Show/Hide the Menu Bar
Choose Hide/Show Menubar from the Options menu.
Performance Meter hides the menu bar.
You can re-display the menu bar at any time by clicking once on the display area of the Performance Meter main window.
To Show/Hide the Line Chart or Area Chart
Choose Hide/Show Strip Chart from the Options menu.
Performance Meter hides the line/area charts for all displayed parameters if they were displayed, or displays the line/area charts if they were hidden.
For each parameter you choose to display, Performance Meter displays:
-
An activity bar to show the instantaneous level for each parameter
-
(Optional) A line chart or an area chart to show the performance for each parameter over time
To Change the Orientation of the Charts
By default, Performance Meter displays the performance charts horizontally (side-by-side). Depending on the number of parameters you monitor and the available space on your desktop, you may want to display them vertically.
-
Choose Setup from the Options menu.
Performance Meter displays the Setup dialog box.
-
Select Vertical or Horizontal to specify the type of chart required.
-
(Optional) Select the Show Limit Line checkbox if you want your charts to indicate the threshold value using a line.
-
Click Apply when you are satisfied with the changes you have made.
Performance Meter displays the performance information in the specified orientation.
To Choose Line Charts or Area Charts
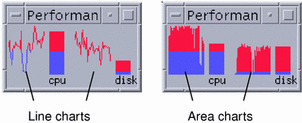
The optional chart displayed for each parameter can be one of the following types:
-
A line chart (the default), which represents activity using a continuous line
-
An area chart, which is the same as a line chart but with the area between the line and the horizontal axis filled

-
Choose Setup from the Options menu.
Performance Meter displays the Setup dialog box.
-
Select the Solid choice button for area charts or the Line choice button for line charts.
-
(Optional) Select the Show Limit Line checkbox if you want your charts to indicate the threshold value using a line.
-
Click Apply when you are satisfied with the changes you have made.
Performance Meter displays the information using the specified charts.
- © 2010, Oracle Corporation and/or its affiliates
