| Exit Print View | |
Sun OpenDS Standard Edition 2.2 Administration Guide |

|
Starting and Stopping Your Server Instance
Configuring the Server Instance
Configuring the Proxy Components
Configuring Security Between Clients and Servers
Configuring Security Between the Proxy and the Data Source
Configuring Servers With the Control Panel
Monitoring Sun OpenDS Standard Edition
Configuring Logs With dsconfig
Configuring Log Retention Policies
To Create a Log Retention Policy
To Modify a Log Retention Policy
Configuring Log Rotation Policies
To Create a Log Rotation Policy
Logging Access Control Information
Differences Between Logging in Sun OpenDS Standard Edition and Sun Java System Directory Server
Configuring Alerts and Account Status Notification Handlers
To View All Configured Alert Handlers
Managing Account Status Notification Handlers
To View the Configured Account Status Notification Handlers
To Enable Account Status Notification Handlers
To Create a New Account Status Notification Handler
To Delete an Account Status Notification Handler
Monitoring the Server With LDAP
Viewing Monitoring Information Using the cn=monitor Entry
To View the Available Monitoring Information
To Monitor General-Purpose Server Information
To Monitor Version Information
To Monitor the User Root Back End
To Monitor the Backup Back End
To Monitor the monitor Back End
To Monitor the Schema Back End
To Monitor the adminRoot Back End
To Monitor the ads-truststore Back End
To Monitor the LDAP Connection Handler
To Monitor LDAP Connection Handler Statistics
To Monitor Connections on the LDAP Connection Handler
To Monitor the Administration Connector
To Monitor Administration Connector Statistics
To Monitor Connections on the Administration Connector
To Monitor the LDIF Connection Handler
To Monitor JVM Stack Trace Information
To Monitor the JVM Memory Usage
To Monitor the userRoot Database Environment
To Monitor Remote LDAP Servers
To Monitor a Global Index Catalog
Monitoring Using manage-tasks Command
To View the Replication Repair Logs
General Purpose Enterprise Monitoring Solutions
Monitoring the Server With JConsole
To Configure JMX on a Server Instance
Accessing a Server Instance From JConsole
Viewing Monitoring Information With JConsole
Monitoring the Server With SNMP
Configuring SNMP in the Server
To Configure SNMP in the Server
To View the SNMP Connection Handler Properties
To Access SNMP on a Server Instance
Monitoring a Replicated Topology
Monitoring Replication Status With dsreplication
Advanced Replication Monitoring
Monitoring the Directory Server With the Control Panel
To View Monitoring Information With the Control Panel
Setting LDAP Data Source Monitoring Properties in the Proxy
Modifying Monitoring of Remote LDAP Servers
You can use the proxy control panel to browse configuration information or view monitoring information for various objects within the proxy. The following objects can be monitored:
Server status. This includes viewing the number of open connections and the status of the server. For details on viewing the status of the proxy server, see Checking if the Server is Started or Stopped.
Server details.
Connection handlers.
Network groups.
Data sources.
Workflows and workflow elements.
Distribution configurations.
Load balancing configurations.
Note - Monitoring statistics are accumulated since the last start of the Sun OpenDS Standard Edition proxy.
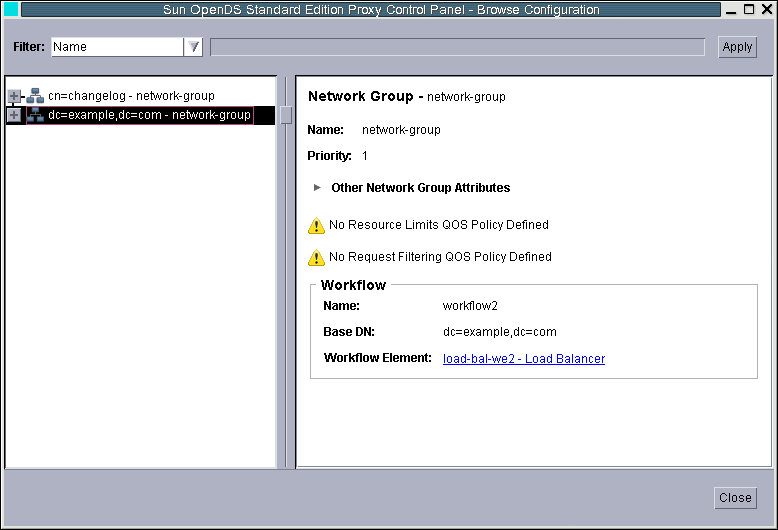
The Browse Configuration window opens. Figure 17 shows the Browse Configuration window displaying monitoring data for a network group.

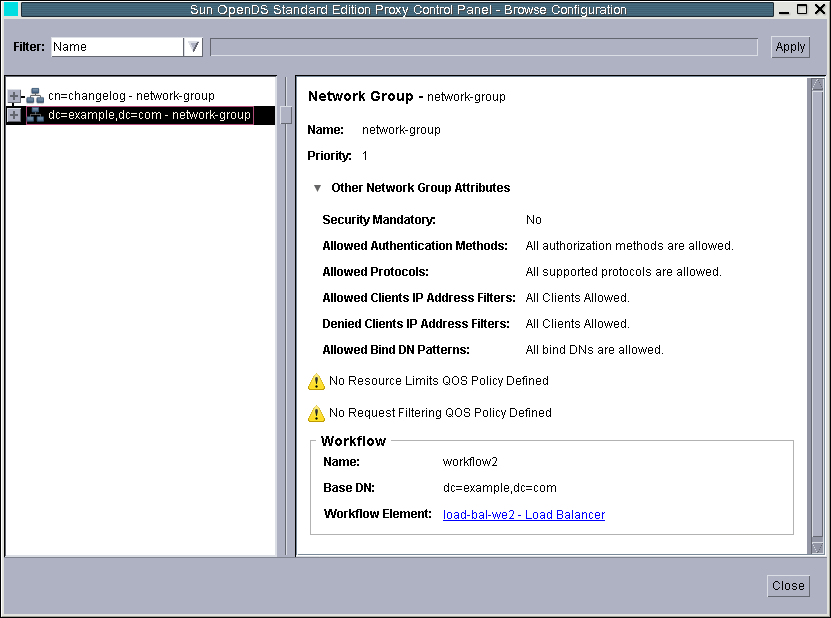
After selecting an object such as a network group, you can see the priority of the object. You can click on the Other Attributes text in the right pane to see information about the various attributes of that object, as shown in Figure 18.

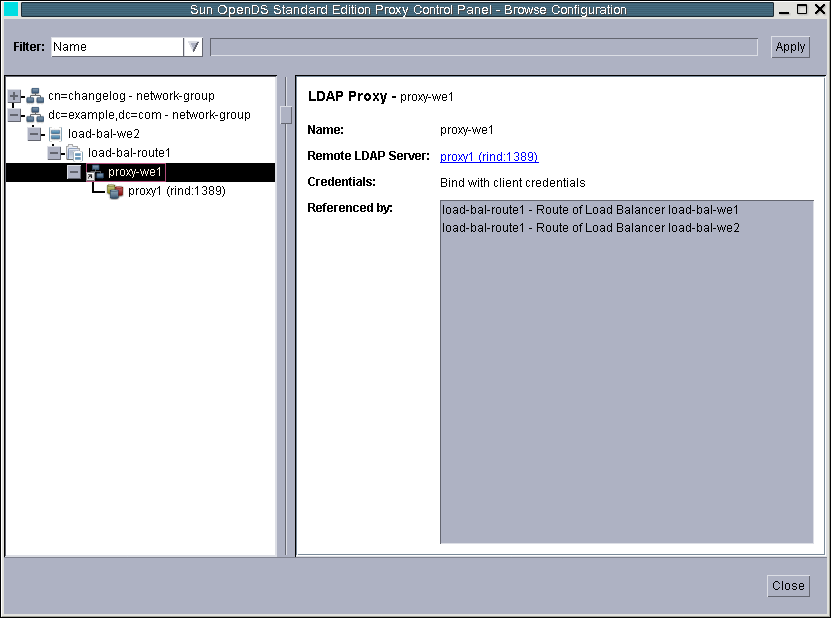
You can also see the complete tree of the configuration by clicking on the + on the left pane, as show in

The monitoring tree is the same as the configuration tree but displays monitoring information associated with each configuration entity.
This contains monitoring data on system information, Java information and work queues. Clicking on System information gives hardware, OS and JVM data. Clicking on Java information includes information on a variety of monitored Java attributes including memory attributes.
Clicking on Work Queue gives statistics on requests submitted, rejected and contained in the backlog.
This contains monitoring information on network groups, proxy workflow elements, distribution workflow elements and global index catalogs. You can drill down on the left pane by clicking on the desired object.
When this is displayed in the right panel, click on Partitions or Other Attributes for detailed monitoring information.
When the details are displayed in the right pane, click on Routes or Other Attributes for detailed monitoring information. Under Routes, you can choose the Show Operations button to select which operations are displayed.
Information on the remote LDAP server is displayed in the right pane.
This contains detailed statistics for incoming traffic per connection handler, per network group, per distribution or per load balancing workflow element.
This contains detailed monitoring statistics for outgoing traffic per data source. Click on Outgoing Traffic in the left pane to open the Outgoing Traffic Monitoring window. Select the statistics that are displayed by clicking on View and choosing Show Operations.