Prorated Comparator (p)
The prorated comparison function uses a relative distance calculation and allows you to specify how quickly the agreement weight between two fields decreases. Matching weights are assigned with a linear adjustment according to the parameters you specify. You specify an initial agreement range. If the difference between two fields falls within that range, the fields are considered a complete match. You also specify a disagreement range ending with the relative distance. If the difference between two fields falls within that range, the fields are considered a non-match. When the difference between the fields falls between those two ranges, they are considered to be partial matches and the agreement weight is adjusted linearly. Any difference greater than the relative distance is always considered a non-match.
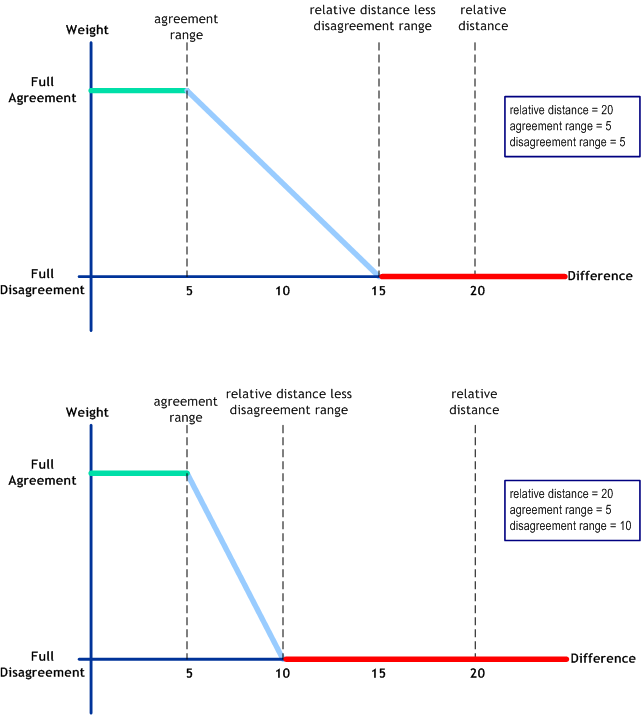
Figure 5 illustrates how weighting is adjusted per the parameters you define. In these diagrams, the green line indicates full agreement, the light blue line indicates prorated agreement, and the red line indicates full disagreement. The diagrams illustrate how increasing the disagreement weight causes the prorated agreement weight to decrease more sharply.
Figure 5 Prorated Linear Adjustment Comparison

The prorated comparison functions takes the parameters listed in Table 42.
Table 42 Prorated Comparison Function Parameters|
Parameter |
Description |
|---|---|
|
The greatest difference between two numbers at which they can still be considered a match or partial match. |
|
|
agreement-range |
The greatest difference between two numbers at which they are considered a full match. This number must be less than the relative distance. |
|
disagreement-range |
This number indicates the minimum difference at which two numbers are considered a non-match and shortens or lengthens the weighting scale. To find this difference, the match engine subtracts this value from the relative distance. If the fields differ by that amount or greater, they are considered to be a non-match. The weighting scale decreases in size as the value of the full-disagreement parameter increases (see diagram). |
- © 2010, Oracle Corporation and/or its affiliates
