Monitoring Collaborations
Enterprise Manager enables you to monitor Collaborations at runtime. You can perform the following tasks:
-
View basic information
-
View consumption information
-
View summary information
-
Stop and restart Collaborations
-
Monitor logs and alerts
For information about monitoring logs, see Monitoring Logs. For information about monitoring alerts, see Monitoring Alerts.
For basic information about Enterprise Manager, see Enterprise Manager Basics.
Viewing Basic Information About a Collaboration
You can view basic information about a Collaboration from Enterprise Manager.

 To View Basic Information About a Collaboration
-
In the Explorer panel of Enterprise Manager, select the Collaboration.
Note –If the Connectivity Map is displayed in the Details panel, you can select the Collaboration in the Connectivity Map.
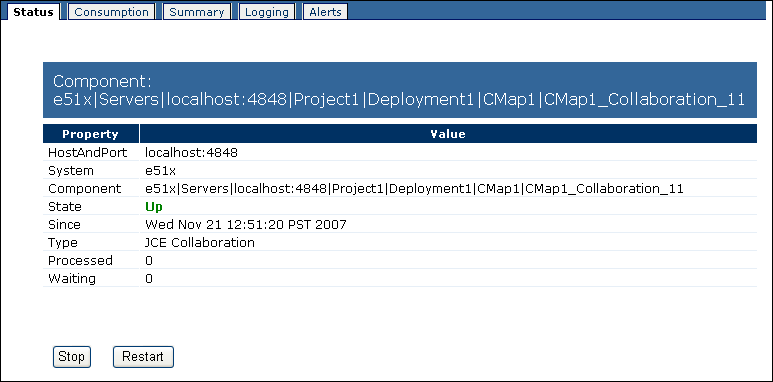
The Status tab appears.
-
View the information.
The HostAndPort row displays the computer name and administrative port on which the Collaboration is running.
The System row indicates whether the Collaboration is located in the Java EE or SRE portion of the Explorer panel.
The Component row displays the hierarchy of the Collaboration in the Explorer panel.
The State row specifies the current status of the Collaboration.
The Since row indicates when the current status began.
The Type row indicates the category of Collaboration (for example, JCE Collaboration).
If the Collaboration subscribes to a topic, then the Subscriber row lists the subscriber name used by the Collaboration.
The Processed row lists the number of messages that the Collaboration has processed.
If the input to the Collaboration is a topic or queue, then the Waiting row lists the number of messages that are waiting to be processed by the Collaboration.
Viewing Consumption Information For a Collaboration
You can view statistics about the consumption of messages by a Collaboration.
 To View Consumption Information For a Collaboration
-
In the Explorer panel of Enterprise Manager, select the Collaboration.
Note –If the Connectivity Map is displayed in the Details panel, you can select the Collaboration in the Connectivity Map.
-
Click the Consumption tab.
The Waiting To Be Processed graphic lists the number of messages that are waiting to be processed by the Collaboration. This graphic appears only if the input to the Collaboration is a topic or queue.
The Processed By Collaboration graphic lists the number of messages that the Collaboration has processed.
Viewing Summary Information For a Collaboration
You can view summary information for a Collaboration.
 To View Summary Information For a Collaboration
-
In the Explorer panel of Enterprise Manager, select the Collaboration.
-
Click the Summary tab.
The Summary tab displays icons for the Connectivity Map components and JMS IQ Managers that are running in the domain.
Stopping and Restarting Collaborations
You can stop and restart Collaborations from Enterprise Manager.
 To Stop a Collaboration
 To Restart a Collaboration
- © 2010, Oracle Corporation and/or its affiliates
