Monitoring Logs
Enterprise Manager enables you to view the log files for the following components:
-
Sun JavaTM System Application Server
-
Sun JavaTM System Message Queue
-
Sun JMS IQ Manager
For basic information about Enterprise Manager, see Enterprise Manager Basics.
Viewing the Application Server Log File
Enterprise Manager enables you to view the server log file for the Sun Java System Application Server.

 To View the Application Server Log File
-
In the Explorer panel of Enterprise Manager, select an application server, Collaboration, or Adapter.
-
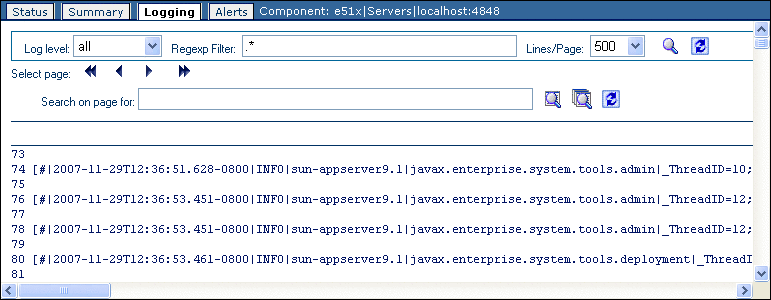
Click the Logging tab or node.
The application server log file appears.
-
To filter the log messages for a specific log level and above, change the setting of the Log Level drop-down list and click the Search icon.
For example, if you select the WARNING log level, then Enterprise Manager displays any WARNING and SEVERE log messages.
-
To perform a regular expression search, use the Regexp Filter field.
The search is case sensitive.
You can enter multiple filters by using an ampersand (&). Here are two examples:
INFO & MBean
Project1 & Service1
-
To change the number of lines that appear in each page, change the setting of the Lines/Page drop-down list and click the Search icon.
-
To open the log messages in a new window, click the Detach Window icon.
-
To search for a string in the log file, enter a string in the Search On Page For field and click the Find On a Page or Find All On a Page icon.
The string must be at least three characters.
The Clear Results icon enables you to remove the highlighting of the search results.
Viewing the Message Server Log File
Enterprise Manager enables you to view the log file for Sun Java System Message Queue and Sun JMS IQ Manager.
 To View the Message Server Log File
-
In the Explorer panel of Enterprise Manager, select the message server node (for example, IQ_Manager_18007 or Sun_JMQ_7676).
-
Click the Logging tab.
The log file appears.
-
To filter the log messages for a specific log level and above, change the setting of the Log Level drop-down list and click the Search icon.
For example, if you select the WARNING log level, then Enterprise Manager displays any WARNING and SEVERE log messages.
-
To perform a regular expression search, use the Regexp Filter field.
The search is case sensitive.
You can enter multiple filters by using an ampersand (&). Here are two examples:
INFO & MBean
Project1 & Service1
-
To change the number of lines that appear in each page, change the setting of the Lines/Page drop-down list and click the Search icon.
-
To open the log messages in a new window, click the Detach Window icon.
-
To search for a string in the log file, enter a string in the Search On Page For field and click the Find On a Page or Find All On a Page icon.
The string must be at least three characters.
The Clear Results icon enables you to remove the highlighting of the search results.
- © 2010, Oracle Corporation and/or its affiliates
