Monitoring Execution of BPEL Processes
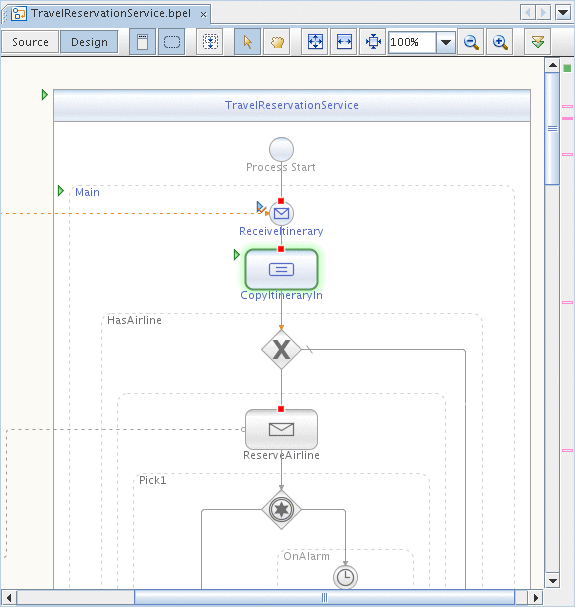
When a running process reaches a breakpoint, the Design view highlights the current position of the debugger and uses colors to differentiate between the states of BPEL activities. As the process advances, the colors and icons for the activities on the diagram are updated to reflect the execution progress.
On the diagram, the following notation is used:
-
Green color (glowing). The breakpoint set for the activity is reached.
-
Gray color (grayed-out effect). The activity has not been executed yet.
-
Green triangle. The activity is now being executed.
-
Blue triangle. The activity has been successfully completed.

You can also monitor the execution of current BPEL process instances in the BPEL Process Execution window (see below).
- © 2010, Oracle Corporation and/or its affiliates
