Administering the Java EE Service Engine
You can administer the Java EE Service Engine instances using the GlassFish Admin Console tools. These tools enable you to monitor and change the Java EE Service Engine's variable values, and suspend, resume, or terminate instances.
 To View the General Properties
-
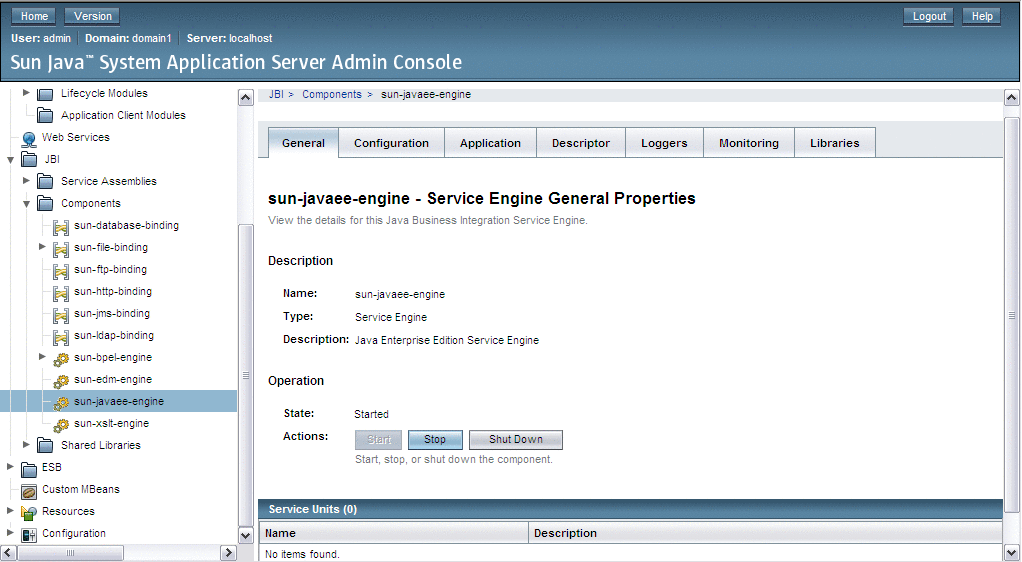
Log in to the GlassFish Administrator Console and on the left pane under the JBI node expand Components and choose sun-javaee-engine
The Java EE Service Engine properties page opens.
Here you can view the details of the Java EE Service Engine, Service Units, and perform Start, stop and shut down operations.

Java EE Service Engine Log Management
The NetBeans IDE provides the ability to define logging for process activities.
Logging is used to write specified expression values or partner links endpoint reference information to the server log. The log level for the Java EE Service Engine is specified through the GlassFish Admin Console.
 To Set the Log Level for the Java EE Service Engine
-
Access the Java EE Service Engine General Properties page.
For more information seeTo View the General Properties.
-
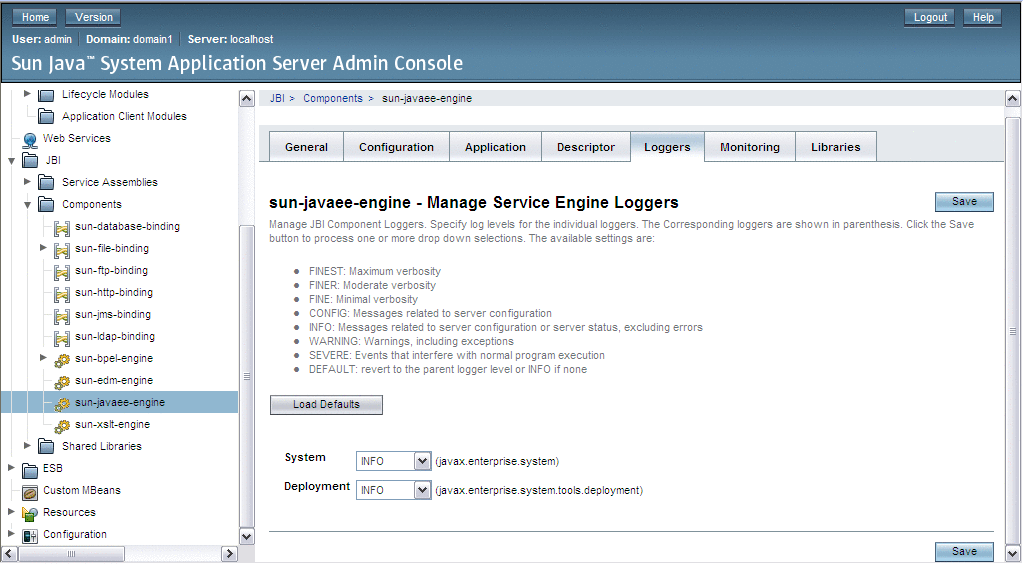
Once on the General Properties page, click the Loggers tab.
-
Choose the appropriate log level for the sun-javaee-engine from the drop down list.
If logging is defined for a process activity, and the log level specified for it corresponds to the log level set for the Java EE Service Engine, after you perform a test run of the process, the selected variable value will be written to the server log file.
The following levels of logging are available:
-
FINEST
-
FINER
-
FINE
-
CONFIG
-
INFO
-
WARNING
-
SEVERE
-
OFF

-
 To View a Log File
-
From the NetBeans IDE's main page, in the Services window, under the Servers node, right-click GlassFish V2 application server node and choose View Server Log from the pop—up menu.
The GlassFish server log opens in the Output window. The activity message value is included in the log. You can use Search to find the log information. Note that some overhead information is hidden.
-
Another alternate method is to view the server log file is in a text editor and see the full information. Navigate to application server installation directory -> domains/domain1 and open the server.log file with the text editor.
The information provided in the log includes the following points, divided with the vertical bar:
-
Date and time of the entry
-
Log level
-
Manager type
-
Thread
-
- © 2010, Oracle Corporation and/or its affiliates
