How Java ES Monitoring Works
Monitoring is the entire process of gathering runtime data, exposing it, and computing quality of service criteria so that the system administrator can assess performance and be notified of alarms During runtime operation, administrators only need to interact with the Monitoring Console to view performance statistics, create rules to monitor automatically, and acknowledge alarms. However, for configuration, troubleshooting and advanced monitoring, it helps to understand the architecture of theMonitoring Framework and how it connects to the Monitoring Console.
Monitoring in Java ES is based on the following concepts:
-
The Common Monitoring Model (CMM) ensures that all Java ES components expose uniform objects and values for comparable attributes.
-
Java objects defined by the CMM interfaces provide standardized instrumentation for product components.
-
A node agent exposes all monitored objects for all components installed on a system and manages the statistics, rules, and alarms for those objects.
-
A master agent on a separate host aggregates all monitored objects from all node agents and makes the data available to the Monitoring Console.
The following sections explain each of these concepts of the monitoring architecture in more detail.
The Common Monitoring Model (CMM)
The basis of a standardized monitoring mechanism is the definition of what objects are monitored and the adoption of these objects across all monitored components. To this end, the monitoring architecture defines the Common Monitoring Model (CMM) as an extension of the Common Information Model (CIM) maintained by the Distributed Management Task Force (DMTF). CMM is both an information model specifying monitored objects such as computer, application, and so on, and a data model specifying uniform values such as the operational status values. As part of the information model, CMM also defines the attributes of an object, for example the number of requests handled by a service, and relations between objects, such as the fact that a service is hosted on a certain computer.
Thanks to CMM, concepts such as applications, services, points of access, and so on are the same for all product components, even if the underlying implementation is different. For example, Web Server might expose a service that handles HTTP requests while Directory Server might expose a service that handles LDAP requests. However the standard object will capture what is common to these two functions, for example the ability to measure the number of requests handled, the average time to respond to a request over a given time period, and so on.
Furthermore, certain data values are standardized so that their meaning is uniform across the entire system. For example, the operational status DEGRADED always means that a service is still available but performance has dropped significantly, no matter which product component is being monitored.
The CMM specification is embodied in the Java interfaces and classes used for the instrumentation, which are described in Appendix A, CMM Object Reference.
CMM Instrumentation
In the Monitoring Framework, the instrumentation is a set of Java interfaces and classes that implement the CMM definitions. For the new monitoring functionality in Java ES, the product components have instrumented their code to instantiate the CMM objects and expose run-time values through the attributes of the monitored objects. The CMM objects that are implemented by each component determines what can be monitored, and for this reason, some components expose less attributes than others. The list of objects and attributes that are exposed for monitoring by each product component is given in Appendix B, Monitored Objects Exposed by Each Component.
Node Agents
In monitoring terminology, a node is a single logical host identified by a unique fully qualified domain name or IP address. A node can be either an entire system or a Solaris zone configured as a virtual system. The node agent communicates with all instrumented components on that host and exposes all of their monitored objects. The node agent also manages all of the logic to collect performance statistics, monitor thresholds defined in rules, and generate alarms for the monitored objects it contains.
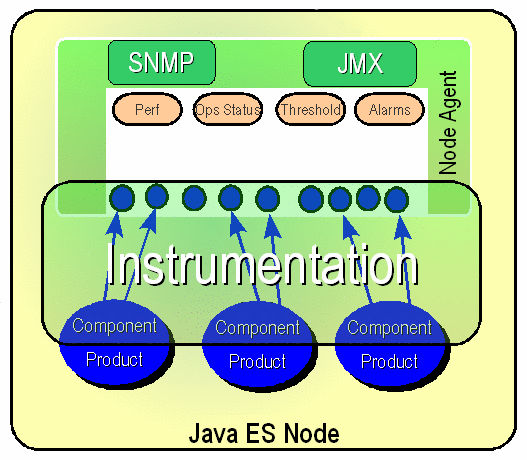
The following diagram represents the contents of a node agent on a single host that has instances of three Java ES product components. It also shows how the instrumentation is instantiated in the node agent to expose values provided by the product components.
Figure 1–1 Diagram of a Node Agent

The node agent is implemented as a module loaded into the Common Agent Container , which is itself a Java Virtual Machine. The implementation of the node agent is based on the Java Management Extensions (JMX), the standard Java extension for monitoring and remote management. Any JMX-enabled monitoring application that understands CMM can access the monitored objects in the node agent. Using JMX functionality, the node agent can also expose certain monitored objects through the Simple Network Monitoring Protocol (SNMP).
The Master Agent
The master agent is deployed on a separate machine as part of the Monitoring Console installation. The master agent is configured with the name or address of all nodes so that it can aggregate the monitored objects from all of the node agents. The master agent is also based on JMX, which it uses to communicate with the node agents, and is also loaded into its local Common Agent Container.
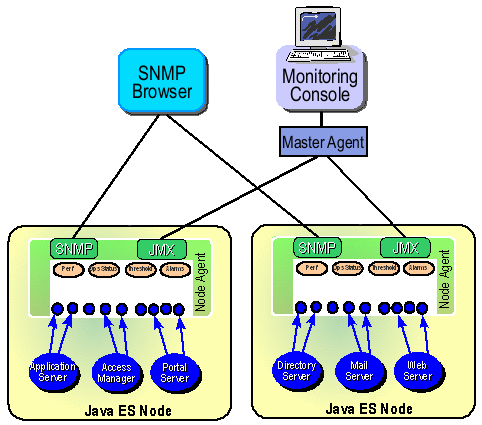
The following diagram represents a master agent connected to two nodes. The Monitoring Console connects to the master agent to monitor the three components on each node. If you wish to use SNMP for monitoring, you must connect to each node separately, because the master agent does not aggregate SNMP attributes. The master agent is designed for use with the Monitoring Console only and cannot be accessed by other monitoring applications.
Figure 1–2 Diagram of the Overall Monitoring Architecture

- © 2010, Oracle Corporation and/or its affiliates
