Chapter 8 Tools for Enhancing MT Programs
Sun provides several tools for enhancing the performance of MT programs. This chapter describes three of them.
Thread Analyzer
Thread Analyzer displays standard profiling information for each thread in your program. Additionally, Thread Analyzer displays metrics specific to a particular thread (such as Mutex Wait Time and Semaphore Wait Time). Thread Analyzer can be used with C, C++, and FORTRAN 77 programs.
LockLint
LockLint verifies the consistent use of mutex and readers/writer locks in multithreaded ANSI C programs.
LockLint performs a static analysis of the use of mutex and readers/writer locks, and looks for inconsistent use of these locking techniques. In looking for inconsistent use of locks, LockLint detects the most common causes of data races and deadlocks.
LoopTool
LoopTool, along with its companion program LoopReport, profiles loops for FORTRAN programs; it provides information about programs parallelized by SPARCompiler FORTRAN MP. LoopTool displays a graph of loop runtimes, shows which loops were parallelized, and provides compiler hints as to why a loop was not parallelized.
LoopReport creates a summary table of all loop runtimes correlated with compiler hints about why a loop was not parallelized.
This chapter presents scenarios showing how each tool is used:
-
Scenario One looks at Mandelbrot, a C program that can be made to run much faster by making it multithreaded. The discussion analyzes the program with Thread Analyzer to see where performance bottlenecks take place, then threads it accordingly.
-
Scenario Two ("Scenario: Checking a Program With LockLint") shows the use of LockLint to check the Mandelbrot program's use of locks.
-
Scenario Three ("Scenario: Parallelizing Loops with LoopTool") shows the use of LoopTool to parallelize portions of a library.
Scenario: Threading the Mandelbrot Program
This scenario shows
-
Threading a program to achieve better performance.
-
Examining the program with Thread Analyzer to determine why it hasn't shown optimal speed-up.
-
Re-writing the program to take better advantage of threading.
Mandelbrot is a well-known program that plots vectors on the plane of complex numbers, producing an interesting pattern on the screen.
In the simplest, nonthreaded version of Mandelbrot, the program flow simply repeats this series:
-
Calculate each point.
-
Display each point.
Obviously, on a multiprocessor machine this is not the most efficient way to run the program. Since each point can be calculated independently, the program is a good candidate for parallelization.
The program can be threaded to make it more efficient. In the threaded version, several threads (one for each processor) are running simultaneously. Each thread calculates and displays a row of points independently.
|
Thread One |
Thread Two |
|---|---|
|
Calculate row (vector 1) |
Calculate row (vector 2) |
|
Display row (vector 1) |
Display row (vector 2) |
However, even though the threaded Mandelbrot is faster than the unthreaded version, it doesn't show the performance speedup that might be expected.

Using Thread Analyzer to Evaluate Mandelbrot
The Thread Analyzer is used to see where the performance bottlenecks are occurring. In our example, we chose to check which procedures were waiting on locks.
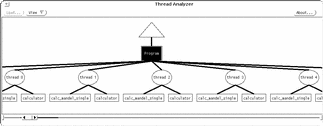
In our example, after recompiling the program to instrument it for Thread Analyzer, we displayed the main window. The main window shows the program's threads and the procedures they call.
Figure 8-1 Thread Analyzer Main Window (partial)
Thread Analyzer allows you to view the program in many ways, including those listed in Table 8-1:
Table 8-1 Thread Analyzer Views|
View |
Meaning |
|---|---|
|
Graph |
Plot the value of selected metrics against wallclock time. |
|
gprof(1) Table |
Display call-graph profile data for threads and functions. |
|
prof(1) Table |
Display profile data for program, threads, and functions. |
|
Sorted Metric Profile Table |
Display a metric for a particular aspect of the program. |
|
Metric Table |
Show multiple metrics for a particular thread or function. |
|
Filter Threads by CPU |
Display the threads whose percent of CPU is equal to or above a designated threshold. |
|
Filter Functions by CPU |
Display the functions whose percent of CPU is equal to or above a designated threshold. |
To look at wallclock and CPU times, choose the Graph view, and select CPU, Wallclock time, and Mutex Wait metrics. Figure 8-2 displays the Graph view of the wallclock and CPU times:
Figure 8-2 Thread Analyzer: Wallclock and CPU Time
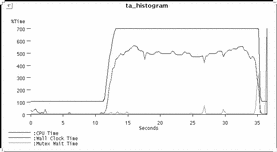
According to this graph, CPU time is consistently below wallclock time. This indicates that fewer threads than were allocated are being used, because some threads are blocked (that is, contending for resources).
Look at mutex wait times to see which threads are blocked. To do this, you can select a thread node from the main window, and then Mutex Wait from the Sorted Metrics menu. The table in Figure 8-3 displays the amount of time each thread spent waiting on mutexes:
Figure 8-3 Thread Analyzer: Mutex Wait Time
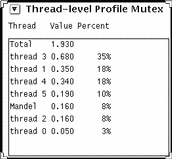
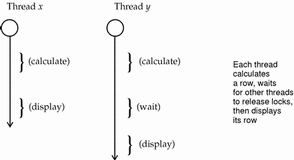
The various threads spend a lot of time waiting for each other to release locks. (In this example, Thread 3 waits so much more than the others because of randomness.) Because the display is a serial resource--a thread cannot display until another thread has finished displaying--the threads are probably waiting for other threads to give up the display lock.
Figure 8-4 shows what's happening.
Figure 8-4 Mandelbrot Multithreaded: Each Thread Calculates and Displays
To speed things up, rewrite the code so that the calculations and the display are entirely separate. Figure 8-5 shows how the rewritten code uses several threads simultaneously to calculate rows of points and write th results into a buffer, while another thread reads from the buffer and displays rows:
Figure 8-5 Mandelbrot Threaded (Separate Display Thread)
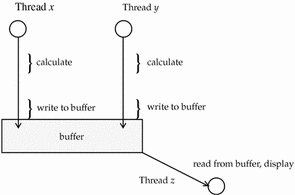
Now, instead of the display procedure of each thread waiting for another thread to calculate and display, only the display thread waits (for the current line of the buffer to be filled). While it waits, other threads are calculating and writing, so that there is little time spent waiting for the display lock.
Display the mutex wait times again to see the amount of time spent waiting on a mutex:
Figure 8-6 Thread Analyzer: Mutex Wait Time (Separate Display Thread)
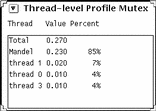
The program spends almost all of its time in the main loop (Mandel), and the time spent waiting for locks is reduced significantly. In addition, Mandelbrot runs noticeably faster.
Scenario: Checking a Program With LockLint
A program can run efficiently but still contain potential problems. One such problem occurs when two threads try to access the same data simultaneously. This can lead to:
-
Deadlocks -- when two threads are mutually waiting for the other to release a lock.
-
Data races -- when two or more threads have overlapping read/write access to data, causing unexpected data values. For example, suppose Thread A writes the variable calc, goes off and does something else, and then comes back to read calc; in the meantime Thread B writes to calc and changes its value to something Thread A does not "expect."
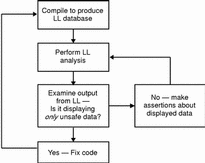
Here's how you can use LockLint to see if data is adequately protected.
Figure 8-7 The LockLint Usage Flowchart
-
Compile the program with LockLint instrumentation.
The compiler has an option to produce a version of the program that LockLint can use for analysis.
-
Create a LockLint shell and load the instrumented program.
You can use this shell as you would any other, including running scripts.
-
Save the executable's state.
LockLint is designed to run iteratively. You run it over and over, making progressively stronger assertions about the data it is analyzing, until you find a problem or are satisfied that the data is safe.
Note -Analyzing the program with LockLint changes its state; that is, once you've done an analysis, you can't add further assertions. By saving and restoring the state, you can run the analysis over and over, with different assertions about the program's data.
-
Analyze the program.
The analyze command performs consistency checks on the program's data.
-
Search for unsafe data.
Having run the analysis, you can look for unprotected elements.
The held=[] indicates that variables did not have locks consistently held on them while they were accessed. An asterisk preceding the held=[] indicates that these variables were written to. An asterisk, therefore, means that LockLint "believes" the data is not safe.
Example 8-1 Fragment of Initial LockLint Output
$ lock_lint analyze
$ lock_lint vars -h | grep held
:arrow_cursor								*held={ }
:bottom_row								*held={ }
:box_height								*held={ }
:box_width								*held={ }
:box_x								*held={ }
:busy_cursor   *held={ }
:c_text *held={ }
:calc_mandel    *held={ }
:calc_type  *held={ }
:canvas *held={ }
:canvas_proc/drag   *held={ }
:canvas_proc/x  *held={ }
[. . . ]
:gap								*held={ }
:gc								*held={ }
:next_row								*held={ }
:now.tv_sec								held={ }
:now.tv_usec								held={ }
:p_text								*held={ }
:panel								*held={ }
:picture_cols								*held={ }
:picture_id								*held={ }
:picture_rows								*held={ }
:picture_state								*held={ }
:pw								*held={ }
:ramp.blue								*held={ }
:ramp.green								*held={ }
:ramp.red								*held={ }
:rectangle_selected	*held={ }
:row_inc								*held={ }
:run_button								*held={ }
[ . . . ]
However, this analysis is limited in its usefulness because many of the variables displayed do not need to be protected (such as variables that are not written to, except when they're initialized). By excluding some data from consideration, and having LockLint repeat its analyses, you can narrow your search to the unprotected variables that you are interested in.
-
Restore the program to its saved state.
To be able to run the analysis again, pop the state back to what it was before the program was last analyzed.
-
Refine the analysis by excluding some data.
For example, you can ignore variables that aren't written to--since they don't change, they won't cause data races. And you can ignore places where the variables are initialized (if they're not visible to other threads).
You can ignore the variables that you know are safe by making assertions about them. In the code example below, the following is done:
-
Initialization functions are ignored because no data is overwritten at initialization.
-
Some variables are asserted to be read-only.
For illustration, this is done on the command line in verbose mode. After you become familiar with the command syntax, you can use aliases and shell scripts to make the task easier.
$ lock_lint ignore CreateXStuff run_proc canvas_proc main
$ lock_lint assert read only bottom_row
$ lock_lint assert read only calc_mandel
etc.
-
-
Analyze the program again, and search for unsafe data.
The list of unsafe data is considerably reduced.
Example 8-2 Unsafe Data Reported by LockLint
$ lock_lint vars -h | grep held
:bottom_row								held={ }
:calc_mandel								held={ }
:colors								held={ }
:corner_i								held={ }
:corner_r								held={ }
:display								held={ }
:drawable								held={ }
:frame								held={ }
:gap								held={ }
:gc								held={ }
:next_row								held={
mandel_display.c:next_row_lock }
:picture_cols								held={ }
:picture_id								held={ }
:picture_rows								*held={ }
:picture_state								*held={ }
:row_inc								held={ }
Only two variables were written to (picture_rows and picture_state) and are flagged by LockLint as inconsistently protected.
The analysis also flags the variable next_row, which the calculator threads use to find the next chunk of work to be done. However, as the analysis states, this variable is consistently protected.
Alter your source code to properly protect picture_rows and picture_state.
Scenario: Parallelizing Loops with LoopTool
IMSL(TM) is a popular math library used by many FORTRAN and C programmers. [IMSL is a registered trademark of IMSL, Inc. This example is used with permission.] One of its routines is a good candidate for parallelizing with LoopTool.
This example is a FORTRAN program called l2trg.f(). (It computes LU factorization of a single-precision general matrix.) The program is compiled without any parallelization, then checked to see how long it takes to run with the time(1) command.
Example 8-3 Original Times for l2trg.f() (Not Parallelized)
$ f77 l2trg.f -cg92 -03 -lmsl
$ /bin/time a.out
real			44.8
user			43.5
sys			1.0
To look at the program with LoopTool, recompile with the LoopTool instrumentation, using the -Zlp option.
$ f77 l2trg.f -cg92 -03 -Zlp -lmsl
Start LoopTool. Figure 8-8shows the initial Overview screen.
Figure 8-8 LoopTool View Before Parallelization
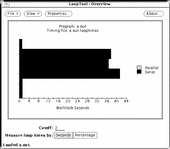
Most of the program's time is spent in three loops; each loop indicated by a horizontal bar.
The LoopTool user interface brings up various screens triggerred by cursor movement and mouse actions. In the Overview window:
Put the cursor over a loop to get its line number.
Click on the loop to bring up a window that displays the loop's source code.
In our example, we clicked on the middle horizontal bar to look at the source code for the middle loop. The source code reveals that loops are nested.
Figure 8-9 shows the Source and Hints window for the middle loop.
Figure 8-9 LoopTool (Source and Hints Window)
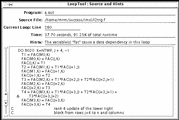
In this case, LoopTool gives the Hints message:
The variable "fac" causes a data dependency in this loop
In the source code, you can see that fac is calculated in the nested, innermost loop (9030):
C                        update the remaining rectangular
C                        block of U, rows j to j+3 and
C                        columns j+4 to n

      DO 9020  K=NTMP, J + 4, -1
         T1 = FAC(M0,K)
         FAC(M0,K) = FAC(J,K)
         FAC(J,K) = T1
         T2 = FAC(M1,K) + T1*FAC(J+1,J)
         FAC(M1,K) = FAC(J+1,K)
         FAC(J+1,K) = T2
         T3 = FAC(M2,K) + T1*FAC(J+2,J) + T2*FAC(J+2,J+1)
         FAC(M2,K) = FAC(J+2,K)
         FAC(J+2,K) = T3
         T4 = FAC(M3,K) + T1*FAC(J+3,J) + T2*FAC(J+3,J+1) +
     &        T3*FAC(J+3,J+2)
         FAC(M3,K) = FAC(J+3,K)
         FAC(J+3,K) = T4
C                        rank 4 update of the lower right
C                        block from rows j+4 to n and columns
C                        j+4 to n
         DO 9030  I=KBEG, NTMP
            FAC(I,K) = FAC(I,K) + T1*FAC(I,J) + T2*FAC(I,J+1) +
     &                 T3*FAC(I,J+2) + T4*FAC(I,J+3)
 9030    CONTINUE
 9020 CONTINUE
The loop index, I, of the innermost loop is used to access rows of the array fac. So the innermost loop updates the Ith row of fac. Since updating these rows does not depend on updates of any other rows of fac, it's safe to parallelize this loop.
The calculation of fac is speeded up by parallelizing loop 9030, so there should be a significant performance improvement. Force explicit parallelization by inserting a DOALL directive in front of loop 9030:
C$PAR DOALL
(Add DOALL directive here)
        DO 9030  I=KBEG, NTMP
            FAC(I,K) = FAC(I,K) + T1*FAC(I,J) + T2*FAC(I,J+1) +
     &                 T3*FAC(I,J+2) + T4*FAC(I,J+3)
 9030    CONTINUE
Now you can recompile the FORTRAN code, run the program, and compare the new time with the original times. More specifically, Example 8-4 shows the use of all the processors on the machine by setting the PARALLEL environment variable equal to 2, and forces explicit parallelization of that loop with the -explicitpar compiler option.
Finally, run the program and compare its time with that of the original times (shown in Example 8-3).
Example 8-4 Post-Parallelization Times for l2trg.f()
$ setenv PARALLEL 2
(2 is the # of processors on the machine)
$ f77 l2trg.f -cg92 -03 -explicitpar -imsl
$ /bin/time a.out
real			28.4
user			53.8
sys			1.1
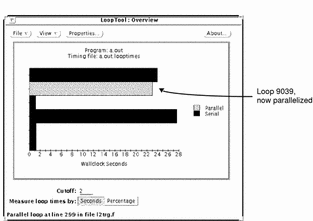
The program now runs over a third faster. (The higher number for user reflects the fact that there are now two processes running.) Figure 8-10 shows the LoopTool Overview window. You see that, in fact, the innermost loop is now parallel.
Figure 8-10 LoopTool View After Parallelization
For More Information
To find out more about Solaris threads and related issues on the World Wide Web (WWW) see the following URL:
http://www.sun.com/sunsoft/Products/Developer-products/sig/threads
Also, the following manuals more information about multithreaded tools:
Thread Analyzer User's Guide 801-6691-10
LockLint User's Guide 801-6692-10
LoopTool User's Guide 801-6693-10
- © 2010, Oracle Corporation and/or its affiliates
