| Exit Print View | |
Sun OpenDS Standard Edition 2.0 Architectural Reference |

|
|
|


|
The Directory Server Access Control Model
Understanding the Directory Server Schema
Understanding Directory Server Plug-Ins
The profiler plug-in provides a basic in-server profiling capability that can be used to monitor performance characteristics and identify potential hot spots in the directory server. It is based on the relatively simple principle of periodically capturing stack traces from all threads in the JVM and collecting them so that they can be aggregated and correlated for later analysis. This tool can be useful for debugging performance problems without the need for any other external tools and without the need to restart the directory server to start and stop profiling. The plug-in has no impact on performance while it is not in use, and it can be relatively inexpensive even when it is capturing data.
The data file that the profiler collects is written in a binary form, and it is necessary to use a tool provided with the directory server in order to be able to view its contents. It can be invoked as a purely command-line tool, but it can also provide a graphical interface to examine the data. To run the tool, go into the directory server instance root and issue the following command (all on one line):
$ java -cp lib/OpenDS.jar org.opends.server.plugins.profiler.ProfileViewer \
-f dataFile -g
where dataFile is the path to the data file containing the data that was collected by the profiler plug-in. This command displays the profiler GUI interface, which looks like the following:
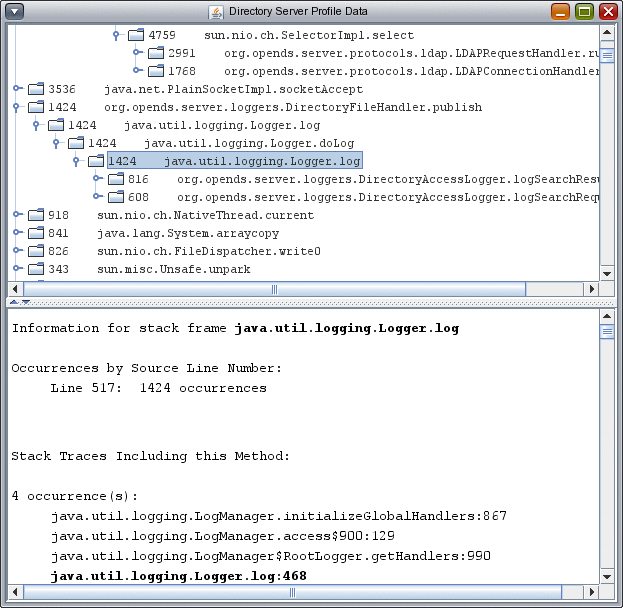
The top panel of the data displayed includes a list of all the leaf methods seen by the profiler, ordered by the number of profile intervals in which that method was seen. Each node can be expanded to show the methods that called it and the number of times they appeared in that particular stack. The bottom panel displays a list of all stack traces where the highlighted method appears.
To invoke the profiler data viewer in command-line mode (to create text-only output), remove the -g option from the command line.
|
|