Chapter 3 Directory Server Monitoring
For information about monitoring Directory Server, see the following sections.
Ways to Monitor Directory Server
Directory Server can be monitored in the following ways:
- Directory Service Control Center
-
Directory Service Control Center, DSCC, can be used to monitor current activities of a Directory Server instance.
DSCC provides general server information, including a resource summary, current resource usage, connection status, and global database cache information. It also provides general database information, such as the database type, status, and entry cache statistics. Cache information and information relative to each index file within the database is also provided. In addition, DSCC provides information relative to the connections and the operations performed on each chained suffix.
- Command line
-
The dsconf command can be used to configure logging and to monitor the replication status of Directory Server. For information about how to configure logging, see Configuring Logs for Directory Server in Sun Java System Directory Server Enterprise Edition 6.2 Administration Guide. For information about how to use the dsconf command for monitoring, see Getting Replication Status by Using the Command Line in Sun Java System Directory Server Enterprise Edition 6.2 Administration Guide.
The ldapsearch command can be used to search the cn=monitor entry for information about current activities of a Directory Server instance. For information about cn=monitor, see Directory ServerMonitoring Attributes.
- Log analyzer tool
-
The Directory Server Resource Kit provides a log analyzer tool called logconv(1).
The logconv tool extracts usage statistics and counts the occurrences of significant events in the access logs.
- Java Management Extensions, JMX
-
Directory Server exposes management information through JMX according to the Common Monitoring Information and Data Model. See the Sun Java Enterprise System 5 Monitoring Guide for details.
Java ES Monitoring Framework, Java ES MF, provides an JMX entry point to retrieve data. For information about the JMX entry points exposed for monitoring Directory Server, see Directory Server and SNMP.
- Simple Network Management Protocol, SNMP
-
Directory Server exposes management information through SNMP. See the Sun Java Enterprise System 5 Monitoring Guide for details.
Java ES MF provides an SNMP entry point to retrieve SNMP data. For information about the SNMP entry points exposed for monitoring Directory Server, see Directory Server and SNMP.
- Simple Object Access Protocol, SOAP
-
Java ES MF provides a SOAP entry point to retrieve data. See the Sun Java Enterprise System 5 Monitoring Guide for details.
Directory Server and SNMP
Directory Server implements the dsTable and the dsApplIfOpsTable of the Directory Server Monitoring MIB defined by RFC 2605. It does not implement the dsIntTable.
Directory Server also implements the Network Services Monitoring MIB defined by RFC 2788.
Directory Server support for SNMP has the following limitations.
-
SNMP support is for monitoring only, no SNMP management is supported.
-
No SNMP traps are implemented.
This rest of this section explains how the information flows from the monitoring application to Directory Server and back, particularly in the case where you use SNMP.
The SNMP interface is exposed by Java ES MF. See the Sun Java Enterprise System 5 Monitoring Guide for details.
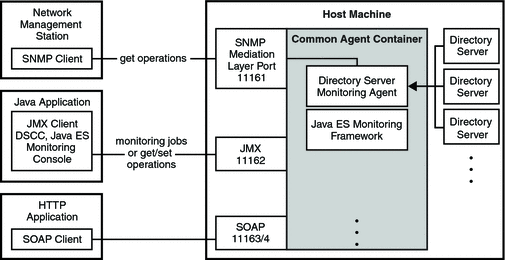
The monitoring framework is contained within the Common Agent Container, cacao, which is installed alongside Directory Server. Figure 3–1 shows the monitoring framework.
Figure 3–1 Overall Monitoring Information Flow

SNMP support for monitoring Directory Server is managed by a Directory Server agent in the Common Agent Container. On Directory Server startup, the Monitoring server plug-in registers theDirectory Server instance with the Directory Server agent within the Common Agent Container.
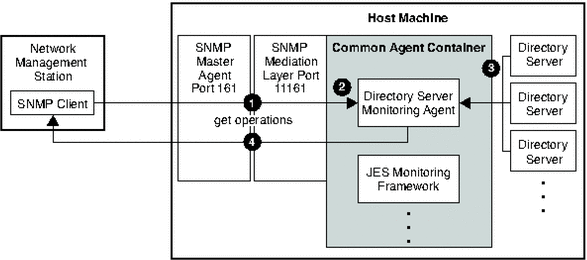
Figure 3–2 shows how SNMP information about Directory Server flows through the Common Agent Container.
Figure 3–2 SNMP Information Flow

-
The network management station sends a GET message through the master SNMP agent, which by default uses standard port 161, to the SNMP mediation layer, which by default uses port 11161.
For information about how to configure access to the SNMP mediation layer, see the Sun Java Enterprise System 5 Monitoring Guide.
-
The SNMP mediation layer forwards any requests destined for the Directory Server to the Directory Server agent.
-
When the server state changes, Directory Server pushes SNMP information to the Directory Server agent.
-
The Directory Server agent relays the response back to the SNMP client via the SNMP mediation layer and master SNMP agent to the network management station. The network management station then displays the data through its network management application.
SNMP information about Directory Server flows as follows.
Directory Server and CMM/JMX
Directory Server supports monitoring through JMX, which is exposed by Java ES MF. See the Sun Java Enterprise System 5 Monitoring Guide for details on the interface itself.
The monitoring framework is contained within the Common Agent Container, cacao, which is installed alongside Directory Server. Figure 3–1 shows the monitoring framework. The information flow for JMX is similar to the flow shown for SNMP in Figure 3–2.
The monitoring information exposed through JMX is organized according to the Common Monitoring Information and Data Model, CMM. CMM allows applications exposing their monitoring information to associate human-readable descriptions with the individual counters and other information. CMM is therefore meant to be self-documenting. Directory Server implements the following CMM classes.
-
CMM_ApplicationSystem
-
CMM_ApplicationSystemSetting
-
CMM_ApplicationSystemStats
-
CMM_InstalledProduct
-
CMM_RFC2605ApplicationSystemSettings
-
CMM_RFC2605ApplicationSystemStats
-
CMM_RFC2605ServiceAccessURIStats
-
CMM_ServiceAccessBySAP
-
CMM_ServiceAccessBySAPStats
-
CMM_ServiceAccessURI
-
CMM_ServiceAccessURIStats
When examining the content of the monitoring information, notice that CMM_ServiceAccessURI is implemented not only for LDAP and for LDAPS, but also for DSML/HTTP or DSML/HTTPS if the DSML front end has been enabled.
Java ES Monitoring Console offers a browser-based user interface to examine the information exposed. See the Sun Java Enterprise System 5 Monitoring Guide for instructions on preparing the Monitoring Console for use.
Directory ServerMonitoring Attributes
Read-only monitoring information is stored under the cn=monitor entry.
cn=monitor
The cn=monitor entry is an instance of the extensibleObject object class. For cn=monitor configuration attributes to be taken into account by the server, this object class, in addition to the top object class, is present in the entry. The cn=monitor read-only attributes are presented in this section.
backendMonitorDN
DN for each Directory Server backend.
For further database monitoring information, refer to dse.ldif(4).
bytesSent
Number of bytes sent by Directory Server.
cache-avail-bytes
The number of bytes available for caching.
connection
List of open connections given in the following format:
connection=31:20010201164808Z:45:45::cn=admin,cn=Administrators,cn=config:LDAP
-
31 is number of the file descriptor used by the server in handling the connection
-
20010201164808Z is the date the connection was opened
-
45 is the number of operations received
-
45 is the number of completed operations
-
cn=admin,cn=Administrators,cn=config is the bind DN
connectionPeak
Maximum number of simultaneous connections since server startup.
currentConnections
Number of current Directory Server connections.
currentTime
Current time usually given in Greenwich Mean Time, indicated by GeneralizedTime syntax Z notation, for example 20010202131102Z.
dTableSize
Size of the Directory Server descriptor table.
entriesSent
Number of entries sent by Directory Server.
nbackEnds
Number of Directory Server backends.
opsCompleted
Number of Directory Server operations completed.
opsInitiated
Number of Directory Server operations initiated.
request-que-backlog
The number of requests waiting to be processed by a thread. Each request received by the server is accepted, then placed in a queue until a thread is available to process it. The queue backlog should always be small, 0 or close to 0. If the queue backlog is large, use the nsslapd-threadnumber attribute to increase the number of threads available in the server.
readWaiters
Number of connections where some requests are pending and not currently being serviced by a thread in Directory Server.
currentpsearches
Number of persistent searches currently running on the server. You can set a maximum number of persistent searches on the server by using the command dsconf set-server-prop max-psearch-count:number.
startTime
Directory Server start time.
threads
Number of operation threads Directory Server creates during startup. This attribute can be set using the nsslapd-threadnumber attribute under cn=config. The nsslapd-threadnumber attribute is not present in the configuration by default, but can be added.
totalConnections
Total number of Directory Server connections.
version
Directory Server version and build number.
cn=disk,cn=monitor
The cn=disk entry enables you to monitor disk conditions over LDAP. This entry is an instance of the extensibleObject object class. A cn=disknumber,cn=disk,cn=monitor entry exists for each disk. The following disk monitoring attributes appear under each of these individual disk entries.
disk-dir
Specifies the pathname of a directory used by the server on disk. Where several database instances reside on the same disk or an instance refers to several directories on the same disk, the short pathname is displayed. The disk numbering is arbitrary.
disk-free
Indicates the amount of free disk space available to the server, in MB.
Note –
The disk space available to the server process may be less than the total free disk space. For example, on some platforms a process that is not running as root may not have all the free disk space available to it.
disk-state
Indicates the state of the disk, based on the available free space and on the thresholds set for disk low and disk full with the configuration parameters nsslapd-disk-low-threshold and nsslapd-disk-full-threshold. Possible values are normal, low, and full.
cn=counters,cn=monitor
This entry holds counter information for the various subtree entry counter plug-ins, if they are enabled.
cn=monitor,cn=Class of Service,cn=plugins, cn=config
This entry holds counters related to the Class of Service plug-in. This entry is an instance of the extensibleObject object class.
classicHashAvgClashListLength
When the CoS plug-in uses the hash table for fast lookup, if more than one classic CoS template corresponds to the hash key used, the plug-in next checks for matches in what is called the clash list, a list of templates sharing an identical hash key. The value of this attribute provides the average length across all hash tables of classic CoS template clash lists, giving some indication of how much linear searching the plug-in must perform after using the hash table during fast lookup.
classicHashAvgClashPercentagePerHash
The average number of clashes per hash table. That is, the average percentage per hash of classic CoS templates sharing an identical hash key.
classicHashMemUsage
The memory overhead in bytes to hold hash tables for fast classic CoS template lookups.
classicHashValuesMemUsage
The memory in bytes used to hold hash values for fast classic CoS template lookups.
numClassicDefinitions
The number of classic CoS definition entries in use.
numClassicHashTables
The number of hash tables created for fast lookup where more than 10 classic CoS templates apply for a single CoS definition. Hash tables are not created for smaller lists of templates.
numClassicTemplates
The number of classic CoS template entries in use.
numCoSAttributeTypes
The number of distinct attributes with values calculated through CoS.
numIndirectDefinitions
The number of indirect CoS definition entries in use.
numPointerDefinitions
The number of pointer CoS definition entries in use.
numPointerTemplates
The number of pointer CoS template entries in use.
- © 2010, Oracle Corporation and/or its affiliates
