Policy Decision Process for Web Agents
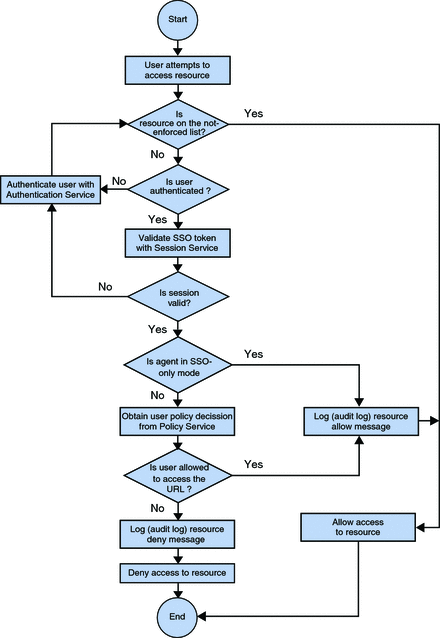
The figure that follows is a flow chart of the policy decision process for web agents. This figure illustrates how a single request is processed. The chart is useful in that it demonstrates to some degree how web agents function.
The chart illustrates possible scenarios that can take place when an end user makes a request for a resource. Therefore, the end user points a browser to a URL. That URL is a resource, such as a JPEG image, HTML page, JSP page, etc. When a resource is under the sphere of influence of the web agent, the agent intervenes to varying degrees, depending on the specifics of the situation, checks the request, and takes the appropriate action, which culminates with the user either being allowed or denied access to the resource. The chart reflects the potential paths a request makes before finally being allowed or denied.
You can see how this web agent-specific flow chart compares to the J2EE agent flow chart as illustrated in Examples of the Policy Decision Process by Agent Type. The comparison gives a sense of how the two agent types differ in how they handle requests for resources.
Figure 2–1 Policy Agent and the Policy Decision Process

- © 2010, Oracle Corporation and/or its affiliates
