Dead Message Queue Contains Messages
Symptom:
-
When you list destinations, you see that the dead message queue contains messages. For example, issue a command like the following:
imqcmd list dst
After you supply a user name and password, output like the following appears:
Listing all the destinations on the broker specified by:
---------------------------------
Host         Primary Port
---------------------------------
localhost    7676
----------------------------------------------------------------------
   Name     Type    State   Producers  Consumers  Msgs
                                         Total    Count  UnAck  Avg Size
------------------------------------------------- ----------------------
MyDest      Queue  RUNNING       0          0        5      0    1177.0
mq.sys.dmq  Queue  RUNNING       0          0       35      0    1422.0
Successfully listed destinations.
|
In this example, the dead message queue, mq.sys.dmq, contains 35 messages.
Possible causes:
-
The number of messages, or their sizes, exceed destination limits.
-
Consumers are not receiving messages before they time out.
There are a number of possible reasons for messages to time out:
Possible cause: The number of messages, or their sizes, exceed destination limits.
To confirm this cause of the problem: Use the QBrowser demo application to inspect the contents of the dead message queue (see To Inspect the Dead Message Queue).
Check the values for the following message properties:
-
JMS_SUN_DMQ_UNDELIVERED_REASON
-
JMS_SUN_DMQ_UNDELIVERED_COMMENT
-
JMS_SUN_DMQ_UNDELIVERED_TIMESTAMP
Under JMS Headers, scroll down to the value for JMSDestination to determine the destination whose messages are becoming dead.
To resolve the problem: Increase the destination limits. For example:
imqcmd update dst -n MyDest -o maxNumMsgs=1000
Possible cause: The broker clock and producer clock are not synchronized.
If clocks are not synchronized, broker calculations of message lifetimes can be wrong, causing messages to exceed their expiration times and be deleted.
To confirm this cause of the problem: Use the QBrowser demo application to inspect the contents of the dead message queue (see To Inspect the Dead Message Queue).
Check whether the JMS_SUN_DMQ_UNDELIVERED_REASON property of messages in the queue has the value EXPIRED.
In the broker log file, look for any of the following messages: B2102, B2103, B2104. These messages all report that possible clock skew was detected.
To resolve the problem: Check that you are running a time synchronization program, as described in Preparing System Resources.
Possible cause: An unexpected broker error has occurred.
To confirm this cause of the problem: Use the QBrowser demo application to inspect the contents of the dead message queue (see To Inspect the Dead Message Queue).
Check whether the JMS_SUN_DMQ_UNDELIVERED_REASON property of messages in the queue has the value ERROR.
To resolve the problem:
-
Examine the broker log file to find the associated error.
-
Contact Sun Technical Support to report the broker problem.
Possible cause: Consumers are not consuming messages before they time out.
To confirm this cause of the problem: Use the QBrowser demo application to inspect the contents of the dead message queue (see To Inspect the Dead Message Queue).
Check whether the JMS_SUN_DMQ_UNDELIVERED_REASON property of messages in the queue has the value EXPIRED.
Check to see if there any consumers on the destination and the value for the Current Number of Active Consumers. For example:
imqcmd query dst -t q -n MyDest
If there are active consumers, then there might be any number of possible reasons why messages are timing out before being consumed. One is that the message timeout is too short for the speed at which the consumer executes. In that case, request that application developers increase message time-to-live values. Otherwise, investigate the following possible causes for messages to time out before being consumed:
Possible cause: There are too many producers for the number of consumers.
To confirm this cause of the problem: Use the QBrowser demo application to inspect the contents of the dead message queue (see To Inspect the Dead Message Queue).
Check whether the JMS_SUN_DMQ_UNDELIVERED_REASON property of messages in the queue has the value REMOVE_OLDEST or REMOVE_LOW_PRIORITY. If so, use the imqcmd query dst command to check the number of producers and consumers on the destination. If the number of producers exceeds the number of consumers, the production rate might be overwhelming the consumption rate.
To resolve the problem: Add more consumer clients or set the destination’s limit behavior to FLOW_CONTROL (which uses consumption rate to control production rate), using a command such as the following:
imqcmd update dst -n myDst -t q -o limitBehavior=FLOW_CONTROL
Possible cause: Producers are faster than consumers.
To confirm this cause of the problem: To determine whether slow consumers are causing producers to slow down, set the destination’s limit behavior to FLOW_CONTROL (which uses consumption rate to control production rate), using a command such as the following:
imqcmd update dst -n myDst -t q -o limitBehavior=FLOW_CONTROL
Use metrics to examine the destination’s input and output, using a command such as the following:
imqcmd metrics dst -n myDst -t q -m rts
In the metrics output, examine the following values:
-
Msgs/sec Out: Shows how many messages per second the broker is removing. The broker removes messages when all consumers acknowledge receiving them, so the metric reflects consumption rate.
-
Msgs/sec In: Shows how many messages per second the broker is receiving from producers. The metric reflects production rate.
Because flow control aligns production to consumption, note whether production slows or stops. If so, there is a discrepancy between the processing speeds of producers and consumers. You can also check the number of unacknowledged (UnAcked) messages sent, by using the imqcmd list dst command. If the number of unacknowledged messages is less than the size of the destination, the destination has additional capacity and is being held back by client flow control.
To resolve the problem: If production rate is consistently faster than consumption rate, consider using flow control regularly, to keep the system aligned. In addition, consider and attempt to resolve each of the following possible causes, which are subsequently described in more detail:
Possible cause: A consumer is too slow.
To confirm this cause of the problem: Use imqcmd metrics to determine the rate of production and consumption, as described above under “Producers are faster than consumers.”
To resolve the problem:
-
Set the destinations’ limit behavior to FLOW_CONTROL, using a command such as the following:
imqcmd update dst -n myDst -t q -o limitBehaviort=FLOW_CONTROL
Use of flow control slows production to the rate of consumption and prevents the accumulation of messages in the destination. Producer applications hold messages until the destination can process them, with less risk of expiration.
-
Find out from application developers whether producers send messages at a steady rate or in periodic bursts. If an application sends bursts of messages, increase destination limits as described in the next item.
-
Increase destination limits based on number of messages or bytes, or both. To change the number of messages on a destination, enter a command with the following format:
imqcmd update dst -n destName -t {q|t} -o maxNumMsgs=number
To change the size of a destination, enter a command with the following format:
imqcmd update dst -n destName -t {q|t} -o maxTotalMsgBytes=number
Be aware that raising limits increases the amount of memory that the broker uses. If limits are too high, the broker could run out of memory and become unable to process messages.
-
Consider whether you can accept loss of messages during periods of high production load.
Possible cause: Clients are not committing transactions.
To confirm this cause of the problem: Check with application developers to find out whether the application uses transactions. If so, list the active transactions as follows:
imqcmd list txn
Here is an example of the command output:
---------------------------------------------------------------------- Transaction ID State User name # Msgs/# Acks Creation time ---------------------------------------------------------------------- 6800151593984248832 STARTED guest 3/2 7/19/04 11:03:08 AM |
Note the numbers of messages and number of acknowledgments. If the number of messages is high, producers may be sending individual messages but failing to commit transactions. Until the broker receives a commit, it cannot route and deliver the messages for that transaction. If the number of acknowledgments is high, consumers may be sending acknowledgments for individual messages but failing to commit transactions. Until the broker receives a commit, it cannot remove the acknowledgments for that transaction.
To resolve the problem: Contact application developers to fix the coding error.
Possible cause: Consumers are failing to acknowledge messages.
To confirm this cause of the problem: Contact application developers to determine whether the application uses system-based acknowledgment (AUTO_ACKNOWLEDGE or DUPES_ONLY) or client-based acknowledgment (CLIENT_ACKNOWLEDGE). If the application uses system-based acknowledgment , skip this section; if it uses client-based acknowledgment), first decrease the number of messages stored on the client, using a command like the following:
imqcmd update dst -n myDst -t q -o consumerFlowLimit=1
Next, you will determine whether the broker is buffering messages because a consumer is slow, or whether the consumer processes messages quickly but does not acknowledge them. List the destination, using the following command:
imqcmd list dst
After you supply a user name and password, output like the following appears:
Listing all the destinations on the broker specified by:
---------------------------------
Host         Primary Port
---------------------------------
localhost    7676
----------------------------------------------------------------------
   Name     Type    State   Producers  Consumers  Msgs
                                         Total    Count  UnAck  Avg Size
------------------------------------------------ -----------------------
MyDest      Queue  RUNNING       0          0        5    200    1177.0
mq.sys.dmq  Queue  RUNNING       0          0       35      0    1422.0
Successfully listed destinations.
|
The UnAck number represents messages that the broker has sent and for which it is waiting for acknowledgment. If this number is high or increasing, you know that the broker is sending messages, so it is not waiting for a slow consumer. You also know that the consumer is not acknowledging the messages.
To resolve the problem: Contact application developers to fix the coding error.
Possible cause: Durable subscribers are inactive.
To confirm this cause of the problem: Look at the topic’s durable subscribers, using the following command format:
imqcmd list dur -d topicName
To resolve the problem:
-
Purge the durable subscribers using the imqcmd purge dur command.
-
Restart the consumer applications.
 To Inspect the Dead Message Queue
A number of troubleshooting procedures involve an inspection of the dead message queue (mq.sys.dmq). The following procedure explains how to carry out such an inspection by using the QBrowser demo application.
-
Locate the QBrowser demo application.
See Appendix A, Platform-Specific Locations of Message Queue Data and look in the tables for “Example Applications and Locations.”
-
Run the QBrowser application.
Here is an example invocation on the Windows platform:
cd \MessageQueue3\demo\applications\qbrowser java QBrowser
The QBrowser main window appears.
-
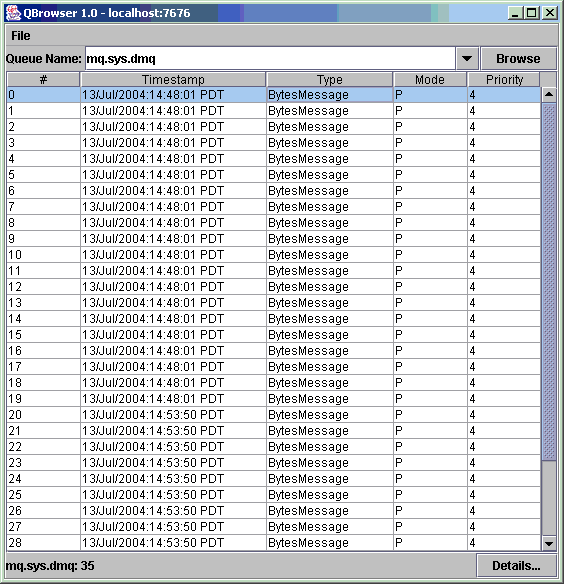
Select the queue name mq.sys.dmq and click Browse.
A list like the following appears:

-
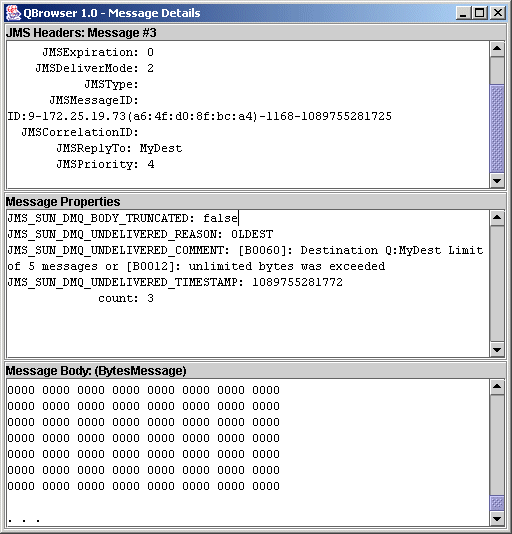
Double-click any message to display details about that message:
The display should resemble the following:

You can inspect the Message Properties pane to determine the reason why the message was placed in the dead message queue.
- © 2010, Oracle Corporation and/or its affiliates
