Chapter 8 Statistics
This Chapter contains information on statistics available through Solaris Bandwidth Manager. You can display statistics using the Solaris Bandwidth Manager configuration tool batool. You can also use the command line statistics utility bastat.
All Solaris Bandwidth Manager statistics are packet-based.
Displaying Statistics Using batool
The Solaris Bandwidth Manager configuration tool batool displays class based, flow based, and overall traffic statistics. In each case, you must first specify which statistics you want to display using the left-hand navigation pane in the relevant statistics window. To do so:
-
Expand the class hierarchy by double-clicking on any definitions displayed as folders.
-
Choose the classes for which you want to see statistics by clicking on the class name. To select more than one class, hold down the control key on your keyboard while clicking.
-
Click Apply.
For example, with the settings shown below, statistics are collected and displayed for incoming and outgoing UDP traffic, but not for TCP traffic.

Displaying Summary Statistics
To display summary statistics:
-
Select the classes for which you want to see statistics using the navigation pane.
-
Specify a polling interval in seconds.
-
Click Resume.

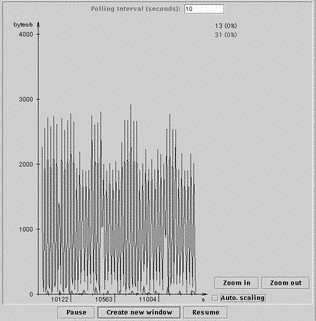
The display uses a different colored line for each class if you specify more than one. The color used is the same as that used to highlight the class name in the statistics navigation window.
The number of bytes sent or received, together with the percentage of bandwidth allocated used, is displayed in the upper right-hand corner of the window. These are shown in the same color as is used in the graph and the statistics navigation window. Move your mouse over the statistics to display the name of the class and interface concerned at the bottom of the window.
To display the statistics in a separate window, so that you can use the main batool window for other tasks, click the Create new window button.
To change the scale used for the statistics display, use the Zoom in and Zoom out buttons.
Displaying Flow Statistics
-
Display the Flow Statistics window by clicking the Flow Statistics tab.
-
Select the classes for which you want to see statistics using the navigation window.
-
Specify the Refresh interval and the number of flows you want to see at one time.
-
Click Resume to begin displaying statistics.
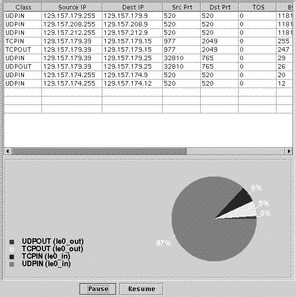
The Flow Statistics window looks like this: The upper pane contains information about traffic exchanges in the different flows. Each line represents a flow and specifies the source and destination IP addresses and port numbers, TOS value, number of bytes and packets exchanged, and a URL, if relevent. The lower pane contains a pie-chart summarizing the percentage of bandwidth used. By default, the pie-chart shows percentage of bandwidth used by each class. However, you can also display percentage of bandwidth used according to any of the values displayed in the top pane. For example, to see bandwidth use classified by source address, click anywhere in the source address column. The display in the lower
pane changes to match.
Displaying Class Statistics
-
Display the Class Statistics window by clicking the Class Statistics tab.
-
Select the classes for which you want to see statistics using the navigation window.
-
Specify the Refresh interval.
-
Click Resume to begin displaying statistics.
The Class Statistics window looks like this: A visual display summarizes the bandwidth use by each class. Traffic in the class is represented by a green line in the right hand pane. If the level of traffic in a class exceeds the maximum allocated bandwidth and bandwidth is borrowed from another class, a red line is used to represent the excess traffic.
Using bastat
The bastat utility displays statistics about how network traffic is being classified and scheduled. It has the following syntax:
/opt/SUNWconn/sbin/bastat [-b] [-I iflist] [-i time] [-n number] [-t] [-o output] [-c|-s|-r] [classnames] |
-
-b instructs bastat to display statistics in bits instead of in bytes. By default, bastat displays the statistics in bytes.
-
iflist is a comma-separated list of names of the interfaces to be polled. If you do not specify the -I option, all interfaces are polled. Specify the interface name in the format name_suffix, where suffix is one of in or out, depending on the direction of traffic handled by the interface. If you do no specify a direction, out is assumed.
-
time is the time in seconds between polls. By default, the poll interval is one second. The time between polls cannot be less than 0.05 seconds.
-
number is the number of polls required. If you specify the -n option, bastat polls this number of times and then exits. By default, polling continues until you stop bastat.
-
-t instructs bastat to display the current totals for each variable, instead of the differences since the last poll interval. By default, bastat displays the differences.
-
output is a comma-separated list of the statistics to be displayed. The following statistics are available:
-
npkts is the number of packets sent
-
nbytes is the number of bytes sent
-
borrows is the number of packets sent using bandwidth borrowed from the parent class
-
drops is the number of packets dropped
-
bdrops is the number of bytes dropped
-
rate is the average throughput in bytes per second
-
parent display the name of the parent class
-
all displays all the available statistics
By default, the number of bytes sent and the throughput rate are displayed.
-
-
-c, -s, or -r indicates the bastat mode:
-
-c poll the children of the given classes.
-
-s poll the subtree of the given classes.
-
-r reset the statistics of the given classes. You must be root or superuser to reset the statistics.
By default only the specified classes are polled.
-
-
classnames is a comma-separated list of the names of the classes to be polled. By default, the root class is polled.
If you do not specify any switches on the command line, bastat displays statistics for the root class for each interface, showing the number of bytes sent and the throughput rate. The poll interval is one second and polling continues until you stop bastat.
bastat Examples
To display all the statistics for all classes on the interface le0, type:
$ bastat -I le0 -s
To display all the statistics for all classes on all interfaces, type:
$ bastat -s
- © 2010, Oracle Corporation and/or its affiliates
