This scalability section contains the results of two studies covering the following topics:
You can refer to these studies for a sample of how the server performs, and how you might configure your system to best take advantage of the iPlanet Web Server's strengths.
For additional performance information, see the Mindcraft white paper "iPlanet Web Server, Enterprise Edition 4.0 and Stronghold 2.4.2 Performance Comparison Analysis and Details" at:
http://www.mindcraft.com/whitepapers/iws/iwsee4-sh242-p2.html
Scalability of Dynamic and Static Content
Scalability for the server varies for different content types, but all types of content scale well. This section describes a study that tests the scalability of various types of content: 100% static, 100% dynamic, and mixed load (30% static + 70% dynamic). Please note that this study was not done using optimal equipment or configuration to produce benchmarks.
Perl-CGI and C-CGI scale the most by a factor of 0.88, followed by SHTML and mixed load, with a scaling factor of 0.79. Java servlets scale moderately by a factor of 0.68. NSAPI's scaling factor is 0.57. Finally, 100% static content's scaling factor is only 0.44, which is expected. The poor scalability of static content is most likely due to the fact that the system only has a single disk to store content, and system performance is bottlenecked on disk I/O. Performance will improve if you spread the data out on more than one disk, or if you use a faster disk or faster file system.
Study Goals
This study shows how well iPlanet Web Server, Enterprise Edition scales against one CPU, two CPUs and four CPUs. This study also helps in determining what kind of configuration (CPU and memory) is required for different types of content. The studies were conducted against the following content:
Study Assumptions
The following assumptions were made to make the studies more realistic:
Setting up the Study
After modifying the /etc/system appropriately (physmem =256MB for one CPU or 512MB for two CPUs or 1GB for four CPUs), we rebooted the server. Using the psradm command, we disabled the desired number of CPUs. We started the server. After making a note of the memory (using top command) and CPU utilization (using vmstat command), we started WebBench clients, first with one client, then with two clients, and so on, until the server CPU utilization was close to 100%.
The result with the highest requests/second and response time no more than 20ms was considered a good reading. We repeated this three times to check for consistency.
Application.
The default configuration (obj.conf and magnus.conf) of iPlanet Web Server, Enterprise Edition 4.0 was used.
Study Tool.
WebBench 3.0.
Server.
The server under test was an E450 with 4 CPUs (168MHz) and 1.6 GB of memory. The server parameters were tuned appropriately.
Clients.
The clients were WIntel (running Windows NT 4.0) machines running 1 or more clients (depending on the size of the machine). In all 7 to 8 machines were used.
Each WebBench 3.0 client was configured to run HTTP 1.0, with 24 threads.
Network.
All systems are connected through a single 100baseT switch.
CPU.
The number of CPUs used was controlled by the psradm command (and
-f option).
Memory.
The amount of physical memory used was controlled by the adding the line set physmem=x in the /etc/system file; where x was equal to 0x8000 for 256 MB, 0x10000 for 512 MB and 0x20000 for 1 GB.
Content.
The static content was a 64 MB tree (provided by WebBench 3.0), containing 6000 files. The files varied in size from 1K to 500K. The document root (in obj.conf) was pointed to this tree, which is on a separate disk. Except NSAPI executables, all other content--such as SHTMl, C-CGI, Perl-CGI and Java servlets--were on the same disk as the document root.
Study Results
The following sections show the results of the study.
100% Static
The study used Web Bench 3.0 standard static content tree comprising files of different sizes totalling about 64 MB. Each file belongs to a particular class depending on its size. The workload characteristics ensure small and medium sized files are accessed more than the large files, reflecting a more realistic stress on the server. The study was first run with defaults (without tuning the file cache with nsfc.conf). The server scales moderately with a scaling factor of 0.40.
The study was run for the second time after tuning the file cache. The scaling factor was still about 0.40. The nsfc.conf was configured to cache or mmap all the content, guaranteeing better performance. Figure 1.1 and Figure 1.2 show the average requests per second and average throughput for 100% static content against one CPU, two CPUs and four CPUs, for both unconfigured and configured nsfc.conf.
Figure 1.1 Requests per second for 100% static content
Figure 1.2 Throughput for 100% static content
Notes
The numbers with an asterisk (*) in the graphs are estimated. These numbers are estimated due to the small number of client machines and plenty of available CPU idle time. When all the four CPUs were enabled, and all available 18 clients were used, the server (CPU) was still idle for approximately 30% of the time, with default file cache (no nsfc.conf present), and about 50% with a relatively tuned nsfc.conf. The maximum numbers obtained were 853 req/second and 5134 KB per second throughput, for default configuration and 955 requests/second and 5900 KB per second throughput when nsfc.conf was tuned.
Also note that the cache-hit ratio typically never reaches 100% unless the study is run a number of times (this is due to statistical nature of the study--not all files in the workload are necessarily accessed during any run).
100% SHTML
This study was run against the file mixed-dirs.shtml. This file has a number of echo statements, an include of 8 KB, and displays the last modification time stamp of a file. Figure 1.3 and Figure 1.4 represent average requests per second and average throughput for 100% SHTML content against one CPU, two CPUs and four CPUs. From the graphs it is clear that the server scales well above average, with a scaling factor of 0.79.
Figure 1.3 Requests per second for 100% SHTML content
Figure 1.4 Throughput for 100% SHTML content
100% C-CGI
100% C-CGI was tested by accessing a C executable called printenv. This executable prints the CGI environment. Figure 1.5 and Figure 1.6 represent average requests per second and average throughput for 100% C-CGI content against one CPU, two CPUs and four CPUs. From the graphs it is clear that the server scales very well for C-CGI content. It scales with a factor of 0.88.
Figure 1.5 Requests per second for 100% C-CGI content
Figure 1.6 Throughput of 100% C-CGI content
100% Perl-CGI
This study ran against a Perl script called printenv.pl. This script prints the CGI environment, just like the C executable printenv does. Figure 1.7 and Figure 1.8 represent average requests per second and average throughput for 100% Perl-CGI content against one CPU, two CPUs, and four CPUs. From the graphs it is clear that the server scales very well, similar to C-CGI. The scaling factor is 0.88.
Figure 1.7 Requests per second for 100% Perl-CGI content
Figure 1.8 Throughput for 100% Perl-CGI content
100% NSAPI
The NSAPI module used in this study was printenv2.so. This module prints the NSAPI environment variables along with some text to make the entire response over 1 KB. Figure 1.9 and Figure 1.10 represent average requests per second and average throughput for 100% NSAPI content against one CPU, two CPUs, and four CPUs.
Figure 1.9 Requests per second for 100% NSAPI content
Figure 1.10 Throughput for 100% NSAPI content

100% Java Servlets
This study was conducted using the WASP servlet. It prints out the servlet's initialization arguments, environments, request headers, connection/client info, URL information, as well as remote user information. Figure 1.11 and Figure 1.12 represent average requests per second and average throughput for 100% Java servlets content against one CPU, two CPUs, and four CPUs. From the graphs it is clear that the server scales moderately well for Java servlets content. The scaling factor is 0.68.
Figure 1.11 Response per seconds for 100% Java servlets
Figure 1.12 Throughput for 100% Java servlets
Mixed Load
The mixed load study was conducted using the 64 MB static content tree for static content, and all the dynamic scripts/executables for the dynamic content. The workload was configured so that 30% of the requests would access files from the static tree, 10% of the requests would access the mix-dir.shtml file, 20% printenv.pl, 20% printenv, 20% the NSAPI.so and the remaining 20% of the requests would access the WASP servlet. Figure 1.13 and Figure 1.14 show average requests per second and average throughput for content with mixed load against one CPU, two CPUs and four CPUs. From the graphs it is clear that the server scales well for content with mixed load. The scaling factor for such a mixed load is 0.79.
Figure 1.13 Requests per second for mixed content
Figure 1.14 Throughput for mixed content
Connection Scalability Study
This study shows how many connections you can have for a given number of CPUs and the memory needed as the number of connections increases.
In terms of the number of requests that the server can handle, it scales well from one CPU to four CPUs. With a load of 5500 concurrent users, the server on a four CPUs system handles close to 2136 requests per second with a reasonable response time.
Each iPlanet Web Server process seems capable of handling up to 1500 requests with a reasonable response time; however, it is recommended that each process handle up to 1000 requests per second. You can increase the number of processes for the optimal performance. Usually, when you increase of number of processes you reduce response time.
In terms of memory footprint, it seems to grow 1 MB for each 350 incremental requests. This is true only for the single process. When the number of processes is increased, the memory footprint becomes 60 MB, with 40 MB of this 60 MB an mmaped file to share data between processes.
Configuration and Study Details
The goal of this exercise was to study the cost of connections on a four CPU system. This study deliberately uses a bare minimum size of index.html. All the load generators are set up to GET this index.html file.
Analysis
Table 1.4, Figure 1.15, and Figure 1.16, show that the number of requests served and throughput scale almost linearly from one CPU to four CPUs, with reasonable response time.
Figure 1.15 Throughput in Number of Requests
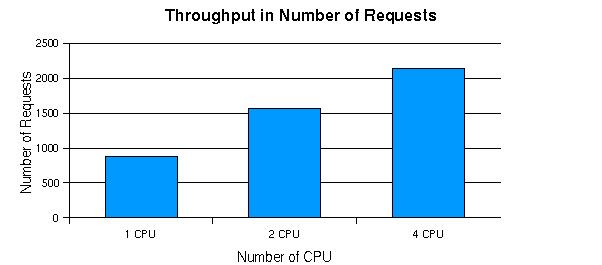
Figure 1.16 Throughput in MB
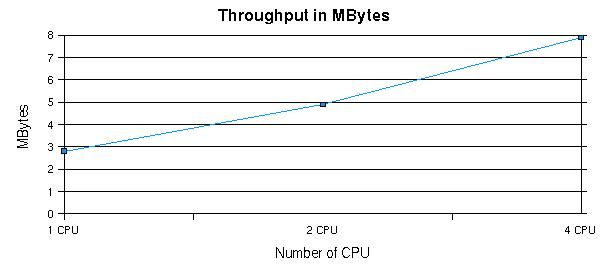
Table 1.5, Figure 1.17, Figure 1.18, and Figure 1.19 show that the throughput and requests handled scale quite well with increasing load on the system from 500 concurrent users all the way up to 5500 clients. Note that we started more than one iPlanet Web Server process when it reached 1500 requests per second, otherwise there are long delays for all the requests.
Figure 1.17 Throughput in MB vs. requested load
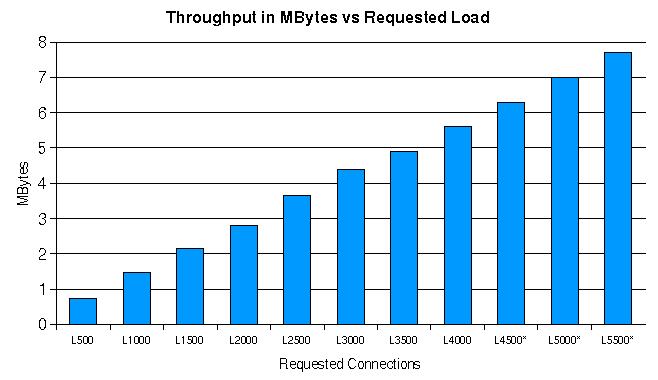
Figure 1.18 Throughput in number of requests vs. requested load

Figure 1.19 Response time vs. requested load
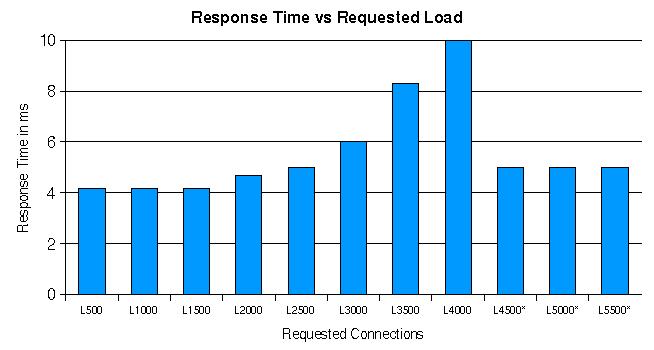
Table 1.6 and Figure 1.20 show that the memory footprint grew about 1M for each additional 1000 load imposed on the system (or each 400 requests). The last three rows of Table 1.6 show MaxProc has been tuned to 3 to increase the performance, since a single iPlanet Web Server process could not handle the number of requests at the load of 4500.
Figure 1.20 Memory usage vs. load imposed
magnus.conf Directive Settings Used in Study
