Chapter 4 Monitoring N1 Grid Engine
This chapter tells you how to get a snapshot of a grid's performance, and how to view details about cluster queues and different types of N1 Grid Engine alerts. All these features are available from the N1 Grid Engine Monitor GUI.
Note –
To actually manage applications using N1GE, you must use the various tools and commands available from N1GE itself. For example, you can use N1GE Monitor GUI to view the status of a submitted job but you cannot actually submit a job from this GUI.
Quickly Viewing Grid Performance
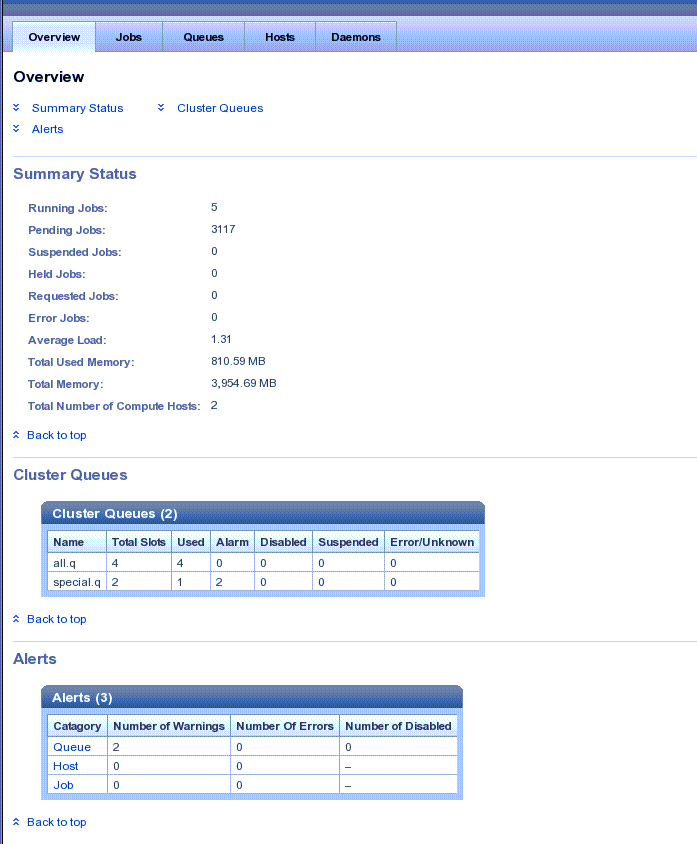
You use the Overview tab to view a quick picture of the health of your grid. This tab displays the Monitoring Overview page which shows three tables that have Summary status, Cluster queue information, and aggregated Alerts for Queues, Hosts, and Jobs.
Note –
You should reload this page to get the freshest data.
Figure 4–1 N1 Grid Engine Monitoring Overview Page

Summary Status Table
The Summary Status table shows the total number of jobs in the grid in various states: pending, running, suspended, and so forth). It also shows the load averaged across all compute hosts and the total amount of used and installed memory summed over all compute hosts.
-
Running Jobs – The number of all the jobs currently running in the grid.
-
Pending Jobs – The number of jobs waiting to be dispatched by the scheduler.
-
Suspended Jobs – The number of jobs that are temporarily suspended.
-
Held Jobs – The number of jobs explicitly held in the pending state.
-
Requeued Jobs – The number of jobs that were formerly running but that have been placed back in the pending state.
-
Error Jobs – The number of jobs no longer running or that never were run due to error conditions like invalid requests.
-
Avg Load – The amount of CPU cycles being used by all the running jobs divided by the number of compute hosts being used by the grid.
-
Total Used Memory – The amount of total memory being used by all the running jobs in the grid.
-
Total Memory – The total amount of memory available across all compute hosts.
-
Total Number of Compute Hosts – The number of hosts available to execute job tasks.
Cluster Queues Table
Throughout its duration, a running job is associated with its queue. Queues provide a way to define various job execution parameters that apply to multiple hosts. You can think of an N1GE queue as a container, or description, for a class of jobs. Queues that span multiple execution hosts are sometimes referred to as cluster queues.
The Cluster Queues table shows a summary of the state of all the cluster queues configured on the grid. The slots are indicative of general performance. The states indicate which queues are running various potential error states. The fields include:
-
Cluster Queue — The name given to a queue.
-
Total Slots — The total number of slots configured for this queue. Slots are the maximum number of jobs that a queue can run simultaneously.
-
Used — The number of total slots currently being used by the queue. Queues should be using all of the total slots, although in some cases, enough free resources might not be available to accommodate every slot.
-
Alarm — When present, indicates that at least one of the load thresholds defined in the load_thresholds list of the queue configuration is currently exceeded. This state prevents N1GE from scheduling further jobs to that queue. For more information, see the queue_conf(5)) man page.
-
Disabled — The number of slots that are not running because the queue or host has been disabled either manually or automatically. All jobs associated with that queue are also disabled. You assign and release this state to a queues using the qmod(1) command. New jobs are also not accepted by these slots, although jobs running continue to run.
-
Suspended — The number of slots that are not running because the queue or host has been suspended either manually or automatically. All jobs associated with these slots are also suspended, and no new jobs are accepted by these slots.
-
Error/Unknown — the number of slots that are in the error state, due either to a problem experienced by a previous job in this slot or else due to a host being unreachable.
For information on cluster queues, see the Monitoring and Controlling Queues section in the N1GE 6 User's Guide and the qmon man page. For more information on queue states see the Queue Alerts.
Alerts Table
The Alerts table displays a quick look at potential or actual problems with the grid. You receive alerts when any of these categories generates a warning, an error, or becomes disabled. Clicking on a category displays the Alert page for that category which contains a table of alerts with additional information. Categories include:
Sorting and Pagination Controls
Items display ten rows at a time. You can see the entire list by using the pagination controls at the bottom of the table. By default, rows are displayed numerically by job ID, but you can use any column to change the ordering of the rows. Clicking on a column header sorts the rows according to the values in that column. Clicking on the column header again reverses the sort. The sorting is preserved across pages if you click on a pagination button.
- © 2010, Oracle Corporation and/or its affiliates
