 To prepare the debugging environment:
-
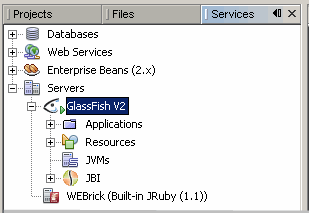
In the Services window, make sure that the GlassFish V2 Application Server is running. The Application Server is running if it has subnodes and is marked with a green triangle.
If the server is not started, right-click it and choose Start from the pop-up menu. For details about how to start the Application Server, see the The BPEL Service Engine section.

-
In the IDE, open the BPEL process in either the Source or Design view.
-
Set breakpoints in the BPEL process.
-
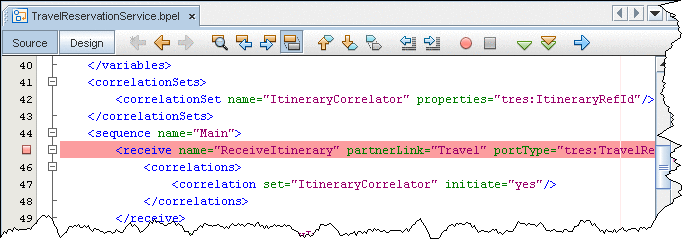
To set breakpoints in the Source view, click next to the line where you want to set the breakpoint.

-
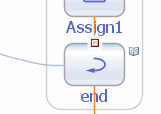
To set breakpoints on the diagram, switch to the Design view, right-click the element and choose Toggle Breakpoint from the pop-up menu. A red square appears at the top of the element with a breakpoint.

-
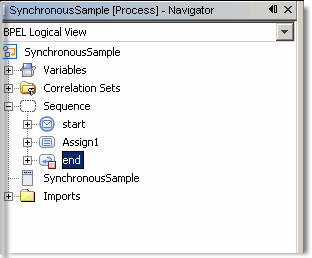
The Toggle Breakpoint pop-up menu command is also available for the elements in the Navigator BPEL Logical View. For the elements with breakpoints, the Navigator shows a small red box (ReceiveItinerary):

-
-
Optionally, you can add watches to monitor XPath expressions. To add a watch, copy the XPath expression you want to monitor, choose Run > Add Watch from the main menu, and paste the expression into the Watch Expression field. Click OK.
Note: You can also add XPath expressions that are not present in the code, but that would be valuable from the debugging point of view.

- © 2010, Oracle Corporation and/or its affiliates
