Debugging BPEL Processes
Debugging BPEL processes follows the same general principles as debugging Java applications. Debugging BPEL processes involves setting breakpoints in the source code and executing the process step-by-step within a debugging session. The BPEL Debugger visually represents the execution of a BPEL process and allows you to view and change variables, monitor the results of executing expressions, and use fault breakpoints tomonitor the state of variables before a fault is thrown.
Steps in Debugging BPEL Processes
The main steps in debugging BPEL processes are:
-
Confirm that the GlassFish application server has started.
-
Create test cases.
For sample processes, test cases are automatically created; for new projects, you need to create at least one test case.
-
Open the BPEL process file either in the Source view or Design view.
-
Set breakpoints in the code or on the diagram. Optionally, add watches for XPath expressions in your process or add fault breakpoints.
-
Start a debugging session. Watch the BPEL Debugger Console window for confirmation that the debugging session has started.
-
Within the debugging session, run one or several test cases.
-
View execution of BPEL processes on the diagram in the Design view or in the BPEL Process Execution window and view running instances of BPEL processes in the BPEL Process Instances window.
-
When an instance stops at a breakpoint, step through the code or the diagram, examine the values of variables in the BPEL Variables window, or observe the values of XPath expressions in the Watches window.
-
Finish the debugging session.
Starting and Finishing a BPEL Debugging Session
A debugging session begins when you connect the BPEL Debugger to the BPEL Service Engine. Only one debugging session can be running with the BPEL Service Engine at a given time.
After a BPEL debugging session starts, you can execute process instances step-by-step, inspecting the values of BPEL variables and XPath expressions in the Local Variables and Watches windows. You can monitor the execution of a BPEL process within a debugger session on the diagram in the Design view: the activities that are being executed are highlighted on the diagram as the current execution position advances. The BPEL Process Execution window also shows the execution of the BPEL process.
 To prepare the debugging environment:
-
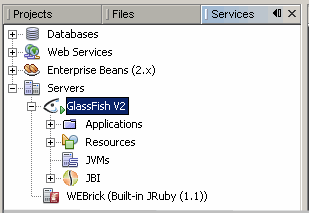
In the Services window, make sure that the GlassFish V2 Application Server is running. The Application Server is running if it has subnodes and is marked with a green triangle.
If the server is not started, right-click it and choose Start from the pop-up menu. For details about how to start the Application Server, see the The BPEL Service Engine section.
-
In the IDE, open the BPEL process in either the Source or Design view.
-
Set breakpoints in the BPEL process.
-
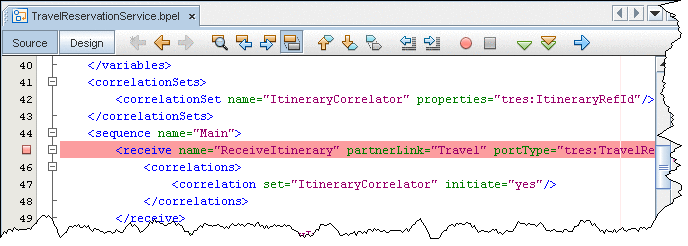
To set breakpoints in the Source view, click next to the line where you want to set the breakpoint.
-
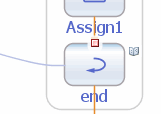
To set breakpoints on the diagram, switch to the Design view, right-click the element and choose Toggle Breakpoint from the pop-up menu. A red square appears at the top of the element with a breakpoint.
-
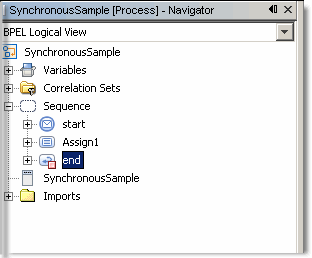
The Toggle Breakpoint pop-up menu command is also available for the elements in the Navigator BPEL Logical View. For the elements with breakpoints, the Navigator shows a small red box (ReceiveItinerary):
-
-
Optionally, you can add watches to monitor XPath expressions. To add a watch, copy the XPath expression you want to monitor, choose Run > Add Watch from the main menu, and paste the expression into the Watch Expression field. Click OK.
Note: You can also add XPath expressions that are not present in the code, but that would be valuable from the debugging point of view.

 To start and finish a debugging session on the BPEL
Engine:
-
In the Projects window, right-click the Composite Applications project you want to debug and choose Debug (BPEL) from the pop-up menu.
A debug session is established on the BPEL Service Engine. Watch the BPEL Debugger Console window for confirmation. The connection might take some time to complete. When it is successfully completed, you can see the new session in the Sessions window and the following messages in the BPEL Debugger Console:
11:35:17 Connecting to localhost:3343
11:36:19 Debug session started
Note that the Debug (BPEL) command performs the following actions:
-
Enables debugging with the BPEL Service Engine (sets the DebugEnabled property of the BPEL Service Engine to true)
-
Builds the Composite Application project and all JBI Modules added to this project
-
Deploys the Composite Application project to the BPEL Service Engine
-
Starts the debugging session by connecting the BPEL Debugger to the BPEL Service Engine
Therefore, whenever you start a debugging session you can be sure that the latest version of the BPEL process is deployed on the BPEL Service Engine.
Now you can run a test case and monitor the execution of the BPEL process until it stops or reaches a breakpoint. As the process advances, the current context is displayed on the diagram and in the BPEL Process Execution window.
If you have several debugging sessions (you may have a Java debugging session running at the same time) and want to change the current session, double-click the name of this session in the Sessions window. Alternatively, right-click the session you want to make current and select Make Current. This session becomes current and the BPEL Process Instances, Watches and Local Variables Windows are updated to show the data related to the new current session.
When you want to finish a debugging session, open the pop-up menu for the session you want to stop and choose Finish in the Sessions window or select Finish Debugger Session on the toolbar. A message that the debugging session is finished is displayed in the BPEL Debugger Console.
To finish all debugging sessions, in the Sessions window, right-click any session and choose Finish All.
-
Using Breakpoints to Debug BPEL Processes
Breakpoints are used to instruct the BPEL Debugger to stop execution at the specified place of a BPEL process. When a BPEL process instance reaches a breakpoint, it becomes suspended and you can step into the code, change the current process instance in the BPEL Process Instances window, track the execution of the process instance in the BPEL Process Execution window and in the Design view, examine the values of variables in the Local Variables window, view the process partner links in the Partner Links window and view the values of XPath expressions in the Watches window.
You can also use fault breakpoints to check the values of variables before a fault is thrown.
To view and organize the breakpoints currently set in the IDE, open the Breakpoints window by choosing Windows > Debugging > Breakpoints (Alt-Shift-5). For each breakpoint, you can see the name of the file and the line where this breakpoint is located. In the Breakpoints window you can enable and disable breakpoints by checking or removing the checkbox in the Enabled column.
 To set a breakpoint in a BPEL process:
-
In the IDE, open the BPEL file in either the Source or Design view.
-
Do one of the following:
-
In the Source view, click the left margin of the row where you want to place a breakpoint.
-
In the Design view, right-click an element where you want to place a breakpoint and choose Toggle Breakpoint (Ctrl-F8).
In the Design view, breakpoints are displayed as small red squares on top of specific elements. In the Source view, breakpoints are shown as red squares on the left margins of code lines.
Alternatively, you can set and remove breakpoints in the BPEL Logical view of the Navigator window by choosing Toggle Breakpoint from the pop-up menu. In the Navigator window breakpoints are shown as small red squares attached to elements.
Once the project has reached the breakpoint it is suspended. You can manage the subsequent execution using the commands available in the Run menu or as buttons on the toolbar.
-
 To debug a process instance that has reached a breakpoint:
-
Within the debugging session the following commands are available:
To be able to use these commands you have to start the debugging session and to run a test case.
-
Pause. Once the user activates this action, the process will continue till it reaches the first element on which it can stop. If there is no current process instance, the debugger will wait for the first execution event from any process instance.
-
Continue (F5). Once the process has reached the breakpoint or is paused you can choose Continue. This action causes the current process instance to run until it encounters the next breakpoint or until the instance completes. The state of the instance changes to Running.
-
Step Into (F7). Steps to the next BPEL activity. As you step, the current line indicator advances, the current position is highlighted on the diagram, and the contents of the BPEL Debugger windows change accordingly. If the current activity has any enclosed elements, the process will step to the first enclosed element. Sometimes it is not visible on the diagram but is reflected in the BPEL Process Execution window. For example, if an Assign activity has <copy> element inside it, from the Assign the process will step to Copy.
-
Step Over (F8). Steps to the next BPEL activity of the same level as the current activity. If the current activity has any enclosed elements, they all are executed without suspension.
-
Step Out (Ctrl-F7). Steps to the next higher level activity of the process. For example, an Assign activity has several Copy elements inside. If one of the Copy elements is the current activity, performing Step Out will move you to the next activity of the Assign level and you will not have to step through all the Copy elements.
-
Run to Cursor (F4). Runs the BPEL process to the position selected in the Navigator window (BPEL Logical View), on the diagram (in the Design view) or to the cursor location in the Source view. When the location of the cursor is reached, the process instance becomes suspended.
-
 To remove a breakpoint from the BPEL process, do one
of the following:
-
On the diagram, click on the small red square indicating the breakpoint. This disables the breakpoint but does not remove it completely.
-
OR: In the Breakpoints window, clear the Enabled checkbox for the breakpoint you want to disable.
Group operations over breakpoints
The toolbar contains three buttons for group operations over the process breakpoints.
-
Enable Breakpoints for Selected Element. Enables all the breakpoints for the selected element and it's enclosed elements.
-
Disable Breakpoints for Selected Element. Disables all the breakpoints for the selected element and it's enclosed elements.
-
Delete Breakpoints for Selected Element. Deletes all the breakpoints for the selected element and it's enclosed elements. If no element is selected on the diagram, the Process element is considered selected for the operations.
Monitoring Execution of BPEL Processes
When a running process reaches a breakpoint, the Design view highlights the current position of the debugger and uses colors to differentiate between the states of BPEL activities. As the process advances, the colors and icons for the activities on the diagram are updated to reflect the execution progress.
On the diagram, the following notation is used:
-
Green color (glowing). The breakpoint set for the activity is reached.
-
Gray color (grayed-out effect). The activity has not been executed yet.
-
Green triangle. The activity is now being executed.
-
Blue triangle. The activity has been successfully completed.
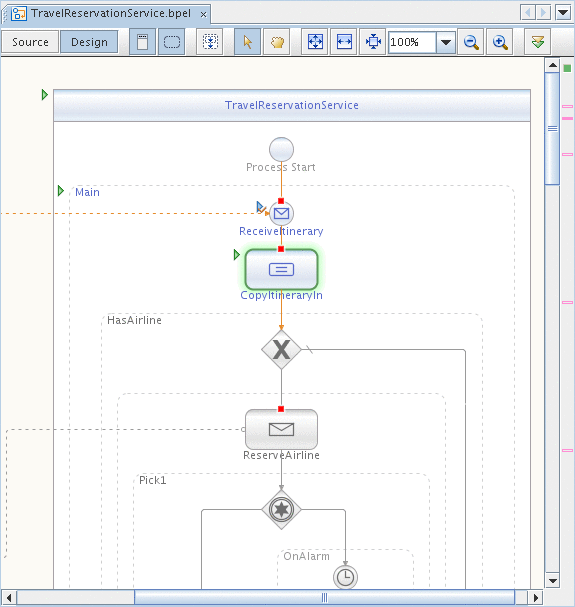
You can also monitor the execution of current BPEL process instances in the BPEL Process Execution window (see below).
- © 2010, Oracle Corporation and/or its affiliates
