| Oracle® Enterprise Data Quality for Product Data Governance Studio Reference Guide Release 5.6.2 Part Number E23609-02 |
|
|
View PDF |
| Oracle® Enterprise Data Quality for Product Data Governance Studio Reference Guide Release 5.6.2 Part Number E23609-02 |
|
|
View PDF |
How to configure and administer the Governance Studio is explained in this chapter.
In order to use the Governance Studio, you must use a DSA that has been properly configured. The configuration requires selection of appropriate output types. The functions of the Governance Studio options for output types are described in this section.
Additionally, this section is a summary of the information required to create a DSA template for a Governance Studio project. For more information on DSA design, see Oracle Enterprise Data Quality for Product Data Application Studio Reference Guide or consult with your Enterprise DQ for Product Administrator.
In the Application Studio, open a DSA, and then double-click any Text output node.
Note:
Governance Studio projects report on text-based output only so the DSA must have at least one text output step that returns results. The Governance Studio ignores other types of outputs such as database outputs provided you set the output type to Not Shown (will not appear in application) as described in this section.Click the Oracle DataLens Governance Studio tab to view the Governance Studio output configuration options.
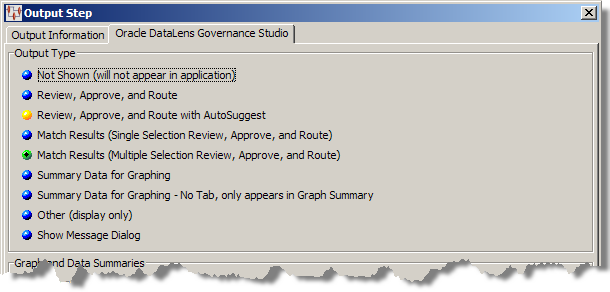
As shown in previous figure, you may choose one of the following output types to determine how data is displayed in the Governance Studio using the Output Step dialog in the Application Studio:
Results will not appear in the Governance Studio console Output tabs. Use this output type for results that do not conform to Governance Studio requirements, such as database output steps.
Results are the records of data that exactly meet the output criteria specified are displayed. Use this output type for displaying the results of a DSA process that requires a person to continue processing.
Results are the records of data that exactly meet the output criteria specified are displayed. Use this output type for displaying the results of a DSA process where the records fall below the quality threshold and require enrichment. A person would have the opportunity to invoke the AutoSuggest feature to provide a set of suggestions to enrich the records that have missing attribute values.
Possible data records meeting match or duplicate criteria are displayed below a split-screen in the output spreadsheet. Only a single data record from the list of matched items can be selected; the record is available for downstream processing. Use this output type to display the results of a DSA template that runs a match process.
Records meeting match or duplicate criteria are displayed below a split-screen in the output spreadsheet. Multiple records from the list of matched items can be selected; the records are available for downstream processing. Use this type for displaying the results of a DSA template that runs a match process.
Summary information is displayed in the graph; no selection of records is available with this option. The bars in the graph operate like buttons and when clicked jump to the Output tab for the data represented in the selected bar.
An individual tab is not created; the data appears in the Graph Summary tab only.
Result information is displayed in a spreadsheet form that does not allow user interaction.
Informational messages, including errors and warnings, are displayed to the user.
This section of the Output Step dialog in the Application Studio is active only when one of the Summary Data for Graphing options are selected as described in the previous section.
There are four graphing options available for the output types. You can mix and match between two sets of options for the graphs and create a label for the X and Y axes as follows:
Bar direction
Horizontal
Vertical bars
Bar color
Multi-color bars
Single-color bars
As shown in following figure, you may choose from the following graphing options to configure how graphs appear in the Governance Studio:
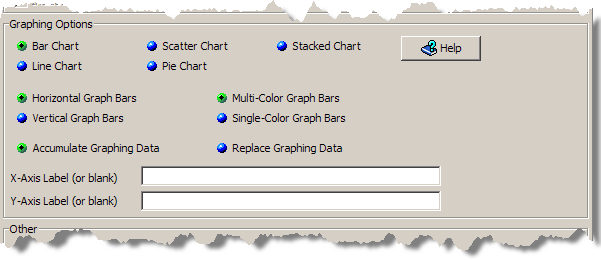
The data values across the defined Output tabs can be compared and displayed in the following types of charts:
A 3-D, colorized visual effect that shows the data in a bar format. The orientation of the bars is determined by the selection of Horizontal Graph Bars or Vertical Graph Bars options. The use of color in this type of chart is defined using the Multi-Color Graph Bars (a different color for each Output tab) or Single-Color Graph Bars (one color for all Output tabs.)
A line connecting the various output data points in a simplified manner.
A series of connected markers that show the data relationship.
A 3-D, colorized representation where each tab is depicted by its percentage of contribution to the total.
A 3-D, colorized representation where each tab is depicted by its percentage of contribution to the total.
The original data is retained when new data is added and all are rendered in the graphs.
All data is replaced by new data prior to rendering in a graph. The DSA is responsible for recalculating the results each time to ensure that the graph has the correct values.
You can add meaningful labels to indicate the data is graphed on the X and Y axes or you can leave it blank to use the default labeling.
Use the Help button to review information about the various graphing options.
Note:
If you modify an output step in the DSA that underlies your Governance Studio project, you must check in your DSA changes and then refresh the Governance Studio project.Once you have added an output step in your DSA and configured it for Governance Studio output, you are ready to create a project in the Governance Studio. This section describes the steps to follow to create and run a Governance Studio project from a DSA created with the Application Studio.
If this is the first time you have started the Governance Studio, the client workspace appears blank as in the following figure; otherwise the results from the last job run are displayed.
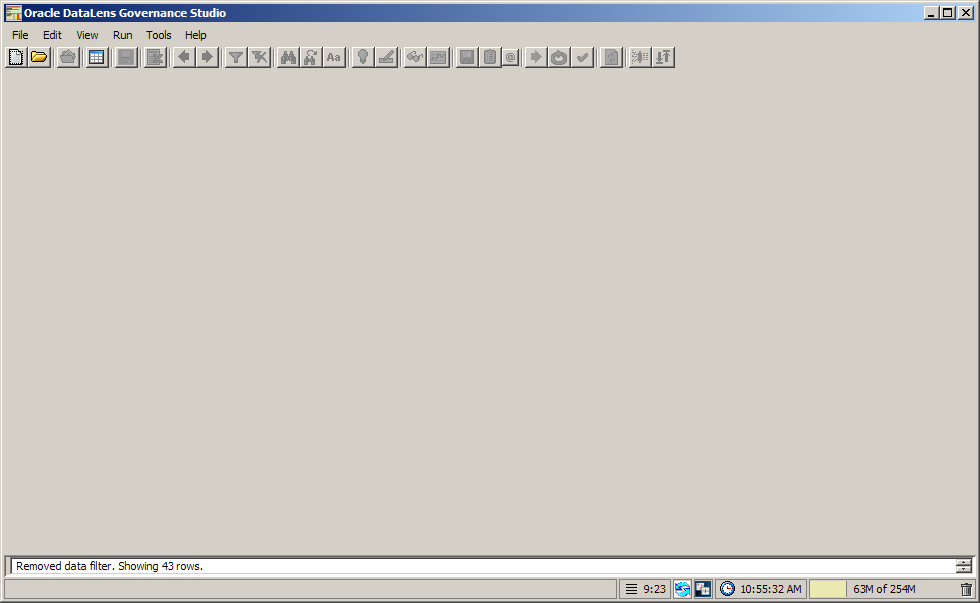
On first use of the Governance Studio GUI, a message is also displayed, requesting that you set the Transform Server to the location of the Oracle DataLens Server that will be running your Governance Studio projects.
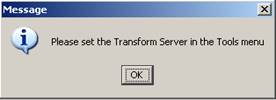
1. Click OK.
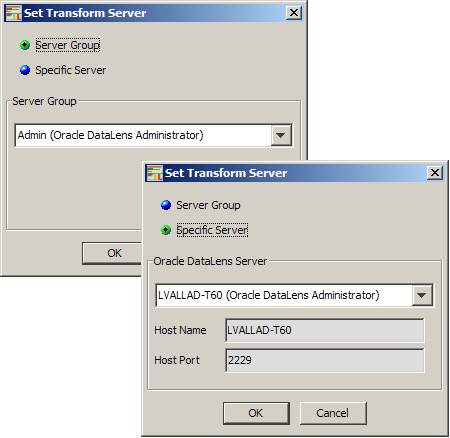
You can choose to select a specific server or a group of servers to use for data transformation.
Select either the Server Group or Specific Server option.
Click the down arrow to view your server options, and select the appropriate server.
If selecting a group of servers, you can choose from the Administrator, Development, Production, or Quality Assurance server groups. The Administrator server group is the default.
Click OK.
The transform server is contacted and this server is used for all data transformations. You can use the Set Transform Server option from the Tools menu to change your Transform Server and host port at any time.
The Governance Studio application start-screen is displayed.
From the File menu, select New Project to create a new Governance Studio project. The Create Project dialog box is displayed as shown in the following figure.
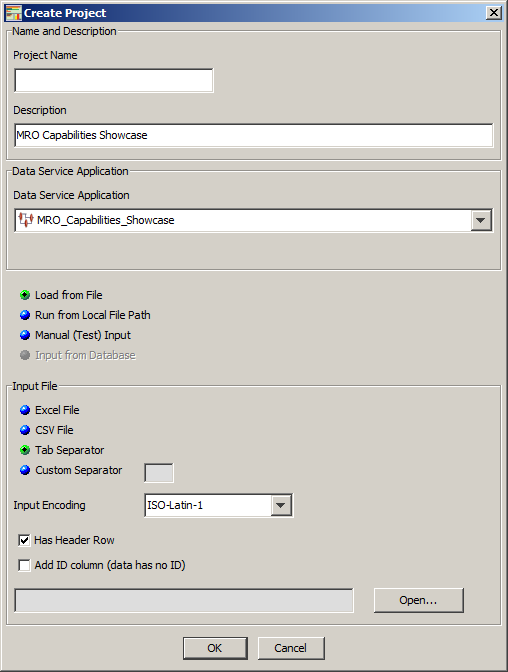
The Create Project dialog creates a new Governance Studio project. Following are the Governance Studio project parameters that you can configure:
Name of the Governance Studio project.
A description of the project. You must specify a description.
Identifies the DSA that is run for the Governance Studio project and how the input data is received. Because Governance Studio requires at least one text output step that returns results, DSAs with no text output are not listed and cannot be used to create a new project.
Specifies the type of input data.
After you specify the project name and supply a description, you must select a DSA from the list of DSAs that have been checked in to your Oracle DataLens Server (for more information on creating DSAs, see Oracle Enterprise Data Quality for Product Data Application Studio Reference Guide). The input data that you specify must be compatible with the specifications of the DSA you created earlier. For more information, see "Configuring a DSA for Governance Studio".
To load the input data into the project, you must first select one of the data modes listed, and then the corresponding input data file type using one of the colorized options. As you hover over a option, the color changes and when you click on it the selected option becomes green.
The options for receiving input data for the DSA are as follows:
Load from File - All data is loaded.
Run from Local File Path - Data is streamed from disk.
Manual (Test) Input - Data is supplied with manual entries.
Input from Database - Data is obtained from a database.
The Create Project dialog box input data types options change based on your data mode selection. For example, if the input data is from a database, only the Input from Database selection is active and is selected by default.
The input data types supported are:
Tab Separator
Excel File
CSV File
Custom Separator
Note:
Count data must be in integer format to avoid generating an error.The following section details an example of opening an input data file to retrieve and load the data.
Select the Load from File option.
Select the Excel File option to specify an Excel file.
Click Open….
The MS Excel File dialog box is displayed.
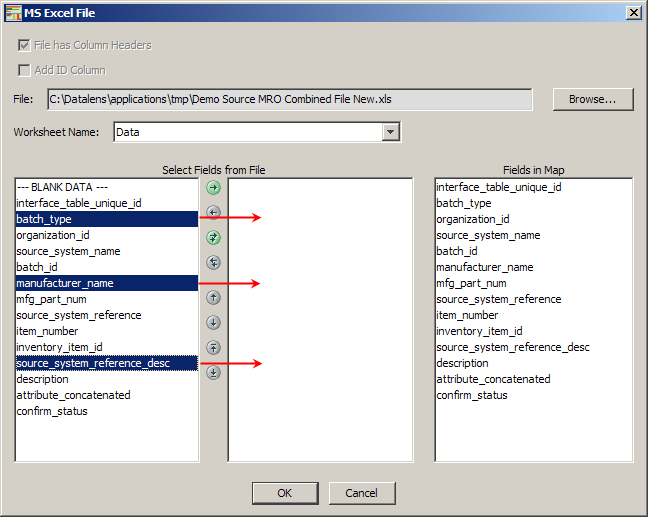
Click Browse, locate the data file, and then double-click it.
If the worksheet containing your data is not selected, select if from the Worksheet Name list.
Select the fields from the input file shown in the left pane that match the fields in the DSAs transform map as shown in the right pane and move them using the arrow buttons.
The single arrow buttons move one field and the double arrow buttons move all fields to the left or to the right. You can reorder how the fields are processed by the DSA using the up and down arrows. The arrows that contain a line above or below it move the selected field to the top or bottom position respectively.
The -BLANK DATA- selection may be used if there are no output fields associated with the input data in the DSA.
Click OK to accept your changes.
You are returned to the Create Project dialog box.
Click OK.
Click the Transform Data button to process the data, which populates the Summary and Output tabs upon a successful run.
Your new Governance Studio project is created and the Source tab of the Governance Studio console displays your input data as shown in following figure.
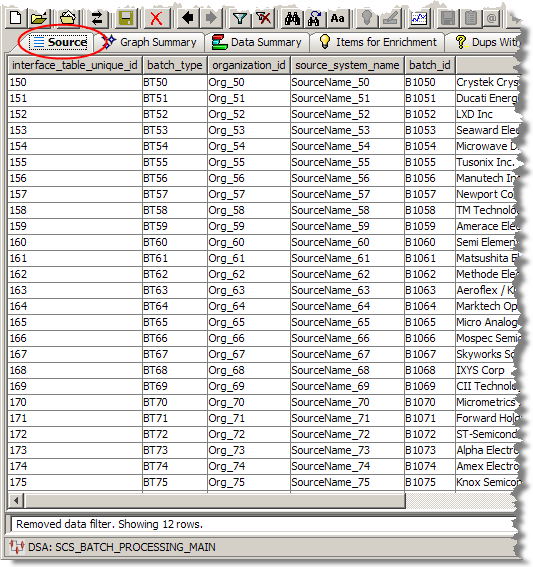
Note:
The Governance Studio input data row limit is 64K rows for Excel 2003 and 1M for Excel 2007. Attempts to load input data files greater than this will result in a file input error. You should create several smaller input data files and process them separately.The data file loading information, including the path to the file, is displayed in the status bar. Below the file information is the name of the DSA that will be used to process the input data.
The ability to create and subsequently open a project from a particular template can be very useful in ensuring consistent use of DSAs. Additionally, it allows privileged users to process multiple batches reusing the same template.
To create a new project from an existing DSA template, from the File menu, click New Project From…. You are prompted for a project ID as shown in the following figure.
Enter a unique ID text string to identify this project and click OK.
This unique text string is appended to the current DSA name so that it is clear which DSA was used to create the template.
For example, if the DSA name is 'SCS_MAIN_PROCESSING' and you enter '1000999', then the template name would be 'SCS_MAIN_PROCESSING_1000999'.
You can open an existing project file without processing and displaying data results in any Output tabs. To open a project without data results, from the File menu, click Open Project - No Results, select the project you want to open, and then click OK.
Note:
If you created your project with version 5.5 or later, the Data Summary tab is populated as this data is saved with the project.This feature is useful in opening a project that previously could not be opened because it exceeded the maximum memory allocation (you can monitor the Memory Cache, located in the client workspace frame, usage as it is dynamically updated). When that is the case, use this feature to open the project as previously described and then set the Conserve Memory and Limits on Rows Retrieved project options as appropriate so that you can process your data. For more information, see "Memory Tab".
Note:
To avoid exceeding the allocated memory, you may need to adjust your client's EDQP Java Web Start memory settings. For more information, see Oracle Enterprise Data Quality for Product Data Oracle DataLens Server Administration Guide.This option can not be used if the project was last run asynchronously though it can be used after you retrieve results using the Open Project command on the File menu.
You can configure project options including how graphs and tabs are displayed with the two options menu selections on the Tools menu.
To set the options for the open project only, from the Tools menu, select Project Options.
To set the global options for all projects in the Governance Studio, from the Tools menu, select Options.
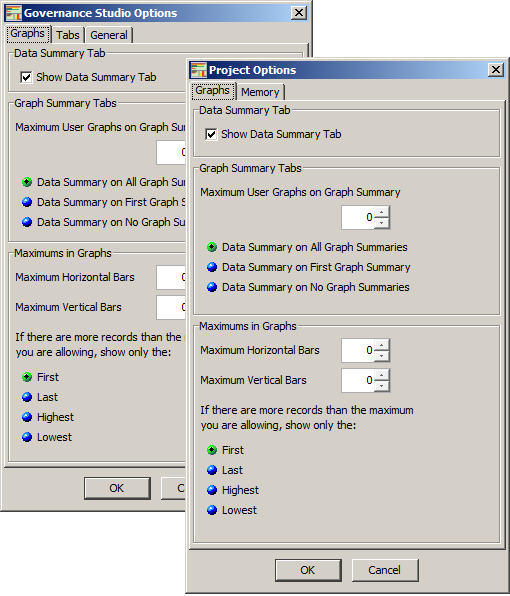
This tab is available for both Governance Studio Options and Project Options. It allows you to specify how graphs are displayed on the Graph Summary and Data Summary tabs.
The Governance Studio Options graphing settings are global and are the default settings when a new project is created. However, the Project Options graphing settings that you define for a project are used for that project only and are exported with the project so that they remain the same when imported by another user.
The following options can be configured:
Select the Show Data Summary Tab check box to show the Data Summary tab.
Set the maximum number of graphs that will be displayed on the Graph Summary tab using the list.
Set the placement of the tab summary by selecting one of the following options:
it appears on all tabs
it appears only on the first tab
no graph summaries appear on any tabs
Set the maximum number of horizontal and/or vertical bars using the lists.
Set which records are shown if the total number of records exceeds the maximum number of bars allowed.
This is an Options tab. It allows you to specify one or the other or both of the following to change the way that tabs display as follows:
All of the tabs are displayed rather than being hidden as described in "Task Panes".
The various icons for the types of tabs are shown on the tab adjacent to the name so that you can easily identify the function of the tab. For example, all Output tabs will display a green check mark or yellow question mark icon while all Data Summary tabs display a bar graph icon.
This is an Options tab. Use the general options as follows:
When set, the time required to complete a job then retrieve and display the data in each Output tab is displayed in the Status Field for your review as in the following example:
Results Retrieved for job 212. Run=57 seconds. Retrieval=5 seconds.
The normal Governance Studio behavior of retrieving and displaying results before the job has completed is suspended when this option is selected.
Allows you to validate the DSA that resides on a local drive rather than the same DSA that resides on the Oracle DataLens Server. The local DSA is the one you have checked-out to modify so this option ensures its validity before checking the DSA into the Oracle DataLens Server.
Additionally, the Governance Studio ensures that the local DSA mirrors the functionality of the Oracle DataLens Server DSA that is used to process the data.
Allows you to set a default number of source data rows beyond which the Governance Studio will display a warning message to allow the user to choose to retrieve all rows or the default number of rows specified. A warning message is displayed for each tab that has a resulting number of transformed rows (result count) higher than the specified warning count.
The default number of rows is set to 5000. Setting it to zero ensures that no warning messages are displayed. Setting a reasonable default can avoid potential memory issues when your project returns large sets of data.
This overall Governance Studio warning count option can be overridden for each Output tab by setting individual limits using the Memory tab of the Project Options as described in the next section.
This is an Project Options tab. Use the options to set how the Governance Studio will use the available memory as follows:
Set this option to populate Output tabs only when the tab is selected thereby saving memory. When you run a job (or load it from disk), the data is retrieved and saved for each Output tab though it is not displayed until it is selected. With this option selected, your project will open and no results are displayed until you click an Output tab.
When using this option, the Keep Lines Cutoff option becomes active so that you can specify if data is to be retained in the selected Output tab when another one is selected.
Note:
You can not use the Re-run button (as described in "Re-Running a Secondary DSA") to reprocess data when this option is set because all Output tabs must be fully populated so that the re-run operation can add data to tabs as necessary.Set the amount of data to be retained in an Output tab when another tab is selected; this option is active after the Conserve Memory check box is selected.
Setting this value to:
zero (the default) - ensures that all of the data is retained in the tab when another one is selected.
> zero - removes the data from the tab if the rows of data exceeds the number specified. For example, if you set the value to 1000 rows and 1200 rows exist, then the data is removed when you select a different tab. Conversely, if only 900 rows exist, then the data remains because it did not exceed the 1000 row limit set.
Set an individual value for the maximum number of rows that will be retrieved for each of the Output tabs. For example, 50,000 rows may be generated for an Output tab and you can choose to retrieve a maximum of 5000 to decrease the amount of time required to process the job.
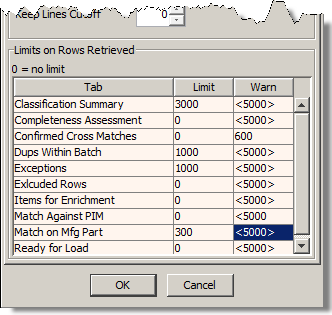
Use the table as follows:
Tab column - Each tab is listed.
Limit column - Enter the maximum number of rows you want to retrieve for one or more tabs. Setting this value overrides the Warn column, locks it from editing, and no warning messages are displayed when the maximum is reached.
Warn column - Use the default warning message value displayed or enter the number of source data rows beyond which the Governance Studio will display a warning message to allow the user to choose to retrieve all rows or the default number of rows specified. If you set this value then enter a Limit value for the tab, the Warn value is reset to the Governance Studio default as it is ignored by the override Limit value. You can reset this value by entering the Governance Studio default warning count surrounded by less than and greater than symbols. For example, if the default warning count was not changed you would enter'<5000>'.
These Limit and Warn values specified override any Default Row Warning Count value set as described in "General Tab".
Tip:
You can find out what the total number of generated rows by viewing the tooltip for a given tab without selecting it.Note:
To avoid exceeding the allocated memory, you may need to adjust your client's EDQP Java Web Start memory settings. For more information, see Oracle Enterprise Data Quality for Product Data Oracle DataLens Server Administration Guide.
|
Copyright © 2001, 2011, Oracle and/or its affiliates. All rights reserved. Legal Notices |
|