| Oracle® Fusion Middleware System Administrator's Guide for Content Server 11g Release 1 (11.1.1) E10792-01 |
|
 Previous |
 Next |
Home > System Administrator' > Using Oracle Fusion Middlew... > Viewing Performance Informa...
| Oracle® Fusion Middleware System Administrator's Guide for Content Server 11g Release 1 (11.1.1) E10792-01 |
|
 Previous |
 Next |
Home > System Administrator' > Using Oracle Fusion Middlew... > Viewing Performance Informa...
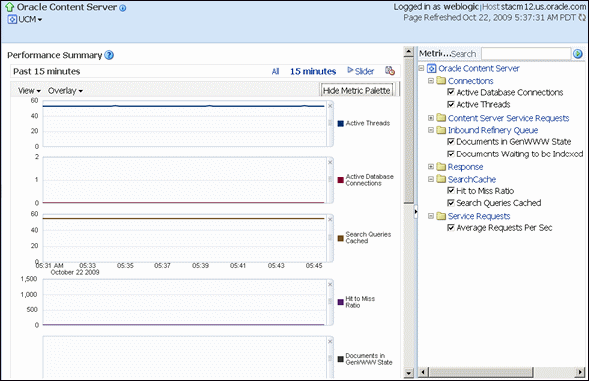
You can monitor performance information for Oracle Universal Content Management UCM) Content Server. Information includes a graphic of metrics for the content server, a summary of the most recent metric values, and a listing of recent service requests.
Figure 2-8 Oracle UCM Performance Summary Page

To view performance information for Oracle UCM Content Server
In the navigation tree, expand the appropriate domain name (for example, UCM_ucm_domain).
Expand Content Management, then Universal Content Management, then Content Server.
Select the Content Server instance name (for example, Oracle Content Server (UCM_server1)). The home page for your Oracle Content Server instance displays.
From the UCM menu on the Oracle Content Server page, select Monitoring, then Performance Summary.
The Performance Summary page displays. It contains information in graphic format.
To select which metrics to display in performance graphs, click the Show Metric Palette button on the Performance Summary page. The Metric Palette lists available options for metrics to display in graphs on the Performance Summary page.
To view metrics in a table format, click Table View.
Check the box for each metric you want to display:
Active Threads: The number of active threads.
Active Database Connections: The number of active database connections made by the content server.
Search Queries Cached: The number of search queries cached (rows).
Hit to Miss Ratio: The hit to miss ratio for the number of search queries performed.
Documents in GenWWW State: The number of documents waiting for Inbound Refinery in a GenWWW state.
Documents Waiting to be Indexed in Done State: The number of documents waiting to be indexed in a Done state.
Average Requests Per Sec: The average number of Services requested per second.
More details about performance information for Oracle Fusion Middleware are available from the Enterprise Manager Administration Console Online Help.