4 Monitoring the SOA Infrastructure
This chapter describes how to monitor the SOA Infrastructure. All SOA composite applications are deployed to the SOA Infrastructure.
This chapter includes the following topics:
-
Section 4.1, "Monitoring SOA Infrastructure Recent Instances and Faults"
-
Section 4.3, "Monitoring Service and Reference Binding Components in the SOA Infrastructure"
For more information, see Section 1.2.1, "Introduction to the SOA Infrastructure Application."
4.1 Monitoring SOA Infrastructure Recent Instances and Faults
You can monitor the SOA composite applications deployed to the SOA Infrastructure.
To monitor SOA Infrastructure recent instances and faults:
-
Access this page through one of the following options:
From the SOA Infrastructure Menu... From the SOA Folder in the Navigator... From the SOA Composite Menu... - Select Home.
- Select soa-infra.
- Select SOA Infrastructure.
The upper part of the SOA Infrastructure Dashboard page displays the following details:
-
Recent SOA composite application instances, instance IDs, and starting times. By default, only running instances are shown.
-
The status of deployed SOA composite applications and their revision numbers, the number of instances created for each application, and the number of faulted instances in each application. The total number of deployed composites also is displayed in parentheses next to the Show All link.
-
Recent faults and rejected messages, including the error message, whether you can recover from the fault, the time at which the fault occurred, the SOA composite application in which the fault occurred, the location of the fault (service binding component, service component, or reference binding component), the instance ID of the SOA composite application, and a link to log messages describing the fault or rejected message. You can recover from faults identified as recoverable at the SOA Infrastructure, SOA composite application, service engine, and service component levels.
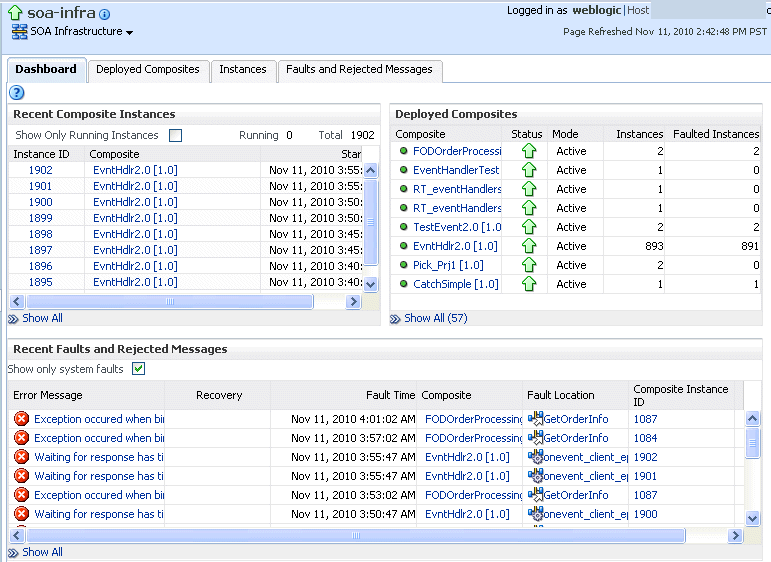
Description of the illustration gs_soahomepage.gif
Note:
After the SOA Infrastructure is started, it may not be completely initialized to administer incoming requests until all deployed composites are loaded. During SOA Infrastructure initialization, a warning message is displayed at the top of the SOA Infrastructure home page. Do not perform operations such as composite deployment, composite undeployment, and others while this message is displayed. For more information, see Section 3.2.1, "Waiting for SOA Infrastructure Startup Initialization to Complete." -
In the Recent Composite Instances section, perform the following tasks:
-
In the Instance ID column, click a specific instance ID to show the message flow through the various service components and binding components.
-
In the Composite column, click a specific SOA composite application to access its home page.
-
Click Show All below the section to access the Instances page of the SOA Infrastructure.
-
-
In the Deployed Composites section, perform the following tasks:
-
In the Composite column, click a specific SOA composite application to access its home page.
-
Click Show All below the section to access the Deployed Composites page of the SOA Infrastructure.
-
-
In the Recent Faults and Rejected Messages section, perform the following tasks:
-
In the Error Message column, click an error message to display complete information about the fault. If the fault is identified as recoverable, click the Recover Now link to perform fault recovery.
-
In the Recovery column, if a fault is identified as recoverable, click Recover to perform fault recovery.
-
In the Composite column, click a SOA composite application to access its home page.
-
In the Fault Location column, click a specific location to access the home page of the service, component, or reference in which the fault occurred.
-
In the Composite Instance ID column, click a composite instance ID to access the flow trace of the message that contains that fault.
-
In the Logs column, click a specific log to access the Log Messages page, with the search criteria prefiltered to display any log messages related to the fault.
-
Click Show All below the section to access the Recent Faults and Rejected Messages page of the SOA Infrastructure.
The lower part of the SOA Infrastructure Dashboard page displays the following details:
-
The number of service components running in the service engines (BPEL process, BPMN process (if Oracle BPM Suite is installed), Oracle Mediator, human workflow, business rules, and spring) and the number of faulted instances for each service engine.
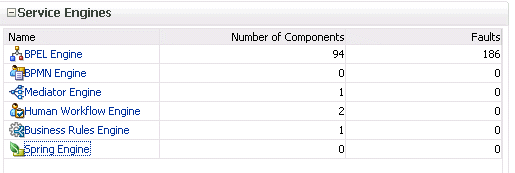
Description of the illustration gs_soahomepage3.gif
-
A graphical representation of the total number of instances and faults for all SOA composite applications since the SOA Infrastructure was last restarted.
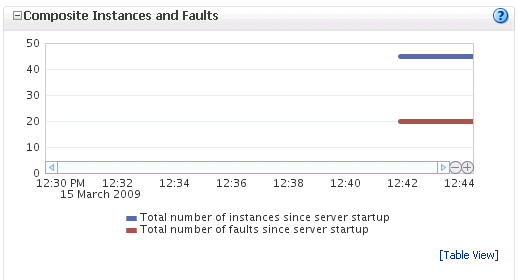
Description of the illustration gs_soahomepage2.gif
-
-
In the Name column of the Service Engines section, click a specific service engine to access its home page.
For more information, see the following sections:
-
Section 1.2.4, "Introduction to Service Components and Service Component Instances"
-
Section 8.1, "Initiating a SOA Composite Application Test Instance"
-
Oracle Fusion Middleware Administrator's Guide for details about viewing and searching log files
4.2 Monitoring Processing Requests
You can monitor SOA Infrastructure processing requests. These are metrics for the message delivery between the service engines, service infrastructure, and binding components. Once a message is handed over to a service engine, the amount of time it takes to process that message (instance processing time) is not captured in these metrics.
To monitor processing requests:
-
Access this page through one of the following options:
From the SOA Infrastructure Menu... From the SOA Folder in the Navigator... - Select Monitoring > Request Processing.
- Right-click soa-infra.
-
Select Monitoring > Request Processing.
The Request Processing page enables you to monitor the following details:
-
The average request processing time for both synchronous and asynchronous messages, active requests, requests processed, and faulted requests in the service engines and service infrastructure.
-
The average request processing time, requests processed, and errors occurring in service (inbound) and reference (outbound) binding components.
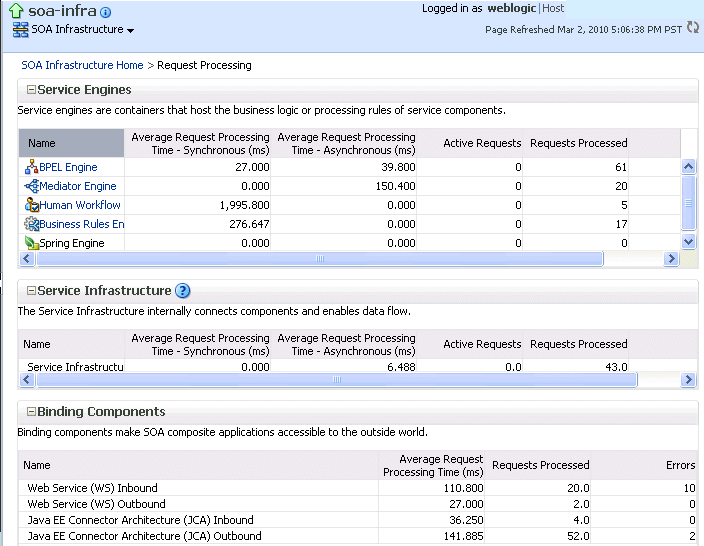
Description of the illustration soainfra_requestproc.gif
-
In the Service Engines section, click a specific service engine (for example, BPEL Engine) to access details such as recent instances using this service engine, components using this service engine, and recent fault occurrences.
For more information, see the following sections:
4.3 Monitoring Service and Reference Binding Components in the SOA Infrastructure
You can monitor all service and reference binding components used in all SOA composite applications deployed to the SOA Infrastructure. Services provide the outside world with an entry point to the SOA composite application. The WSDL file of the service advertises its capabilities to external applications. References enable messages to be sent from the SOA composite application to external services in the outside world.
To monitor service and reference binding components in the SOA Infrastructure:
-
Access this page through one of the following options:
From the SOA Infrastructure Menu... From the SOA Folder in the Navigator... - Select Services and References.
- Right-click soa-infra.
-
Select Services and References.
The Services page displays details about the names and types of the services, the SOA composite applications in which the services are used, the total number of messages processed, the average processing time, and the number of faults occurring in the services.
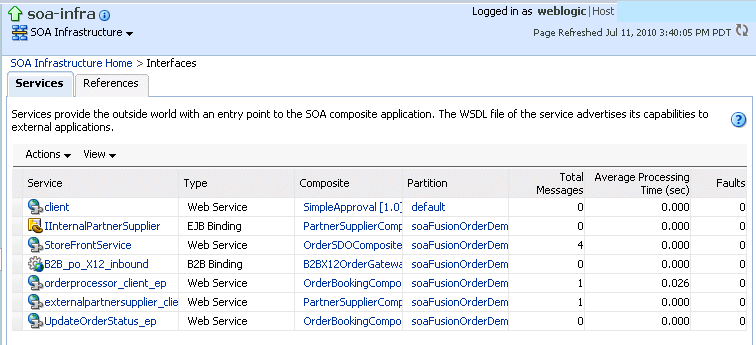
Description of the illustration sca_services.gif
-
In the Service column, click a specific service to access its home page.
-
In the Composite column, click a specific SOA composite application to access its home page.
-
Click the References tab.
The References page displays details about the names and types of the references, the SOA composite applications in which the references are used, the total number of messages processed, the average processing time, and the number of faults occurring in the references.
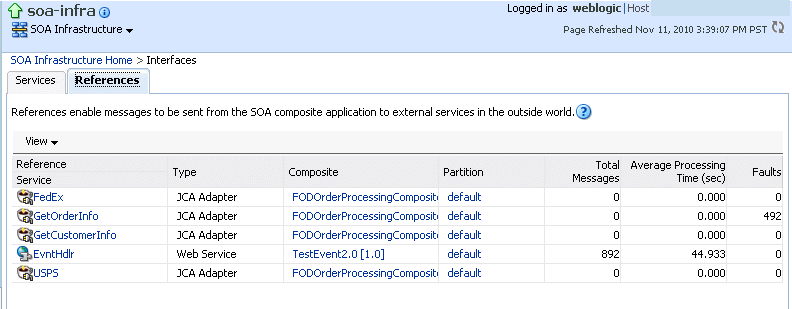
Description of the illustration sca_references.gif
-
In the Reference column, click a specific reference to access its home page.
-
In the Composite column, click a specific SOA composite application to access its home page.
For more information about services and references, Section 1.2.5, "Introduction to Binding Components."