13 Monitoring the Performance of Web Services
This chapter describes how to monitor the performance of a Web service using Fusion Middleware Control. The chapter includes the following sections:
In addition to the monitoring features described in this chapter, see "Analyzing Policy Usage" to analyze how policies are used by one or more Web services.
Overview of Performance Monitoring
Note:
Not all of the monitoring features described in this chapter apply to Java EE Web services.From the Web Services home page in Fusion Middleware Control, you can do the following:
-
Monitor Web services faults, including Security, Reliable Messaging, MTOM, Management, and Service faults.
-
Monitor Security failures, including authentication, authorization, message integrity, and message confidentiality failures.
-
Configure your Web services ports, including enabling and disabling the port, attaching policies to Web services, and enabling or disabling policies.
The Application home page also displays select Web service details if the application includes Web services.
When Are Web Service Statistics Started or Reset?
The statistics described in this chapter are started or reset when any one of the following events occur:
-
When the application is being deployed for the first time.
-
When the application is redeployed.
-
If the application is already deployed, and the hosting server is restarted.
Viewing Web Service Statistics from the Summary Page
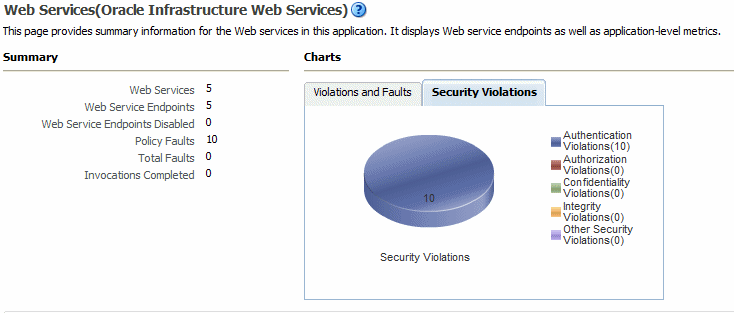
In Fusion Middleware Control, the Web Services summary page for an application displays the collective Summary and fault/violation information for all Web services in the application, as shown in Figure 13-1.
The Charts section shows a graphical view of all security faults for a Web service.
To navigate to the Web Service Summary page for a Web service
-
From the navigator pane, click the plus sign (+) for the Application Deployments folder to expose the applications in the domain, and select the application.
The Application Deployment home page is displayed.
-
Using Fusion Middleware Control, click Application Deployment, then click Web Services.
The Web Services Summary page for this application is displayed.
The page displays Web service endpoints as well as application-level metrics.
The following Web service-wide statistics are displayed:
-
Web Services (Number of Web services in the application)
-
Web Service Endpoints
-
Web Service Endpoints Disabled
-
Total Policy Violations
-
Total Faults
-
Invocations Completed
Figure 13-1 Web Services Performance Summary and Charts

Description of "Figure 13-1 Web Services Performance Summary and Charts"
Viewing Web Service Statistics for a Server Instance
The server-side Web services page displays statistics for all of the Web services on that server.
To view the Web service statistics for a server
-
In the navigator pane, expand WebLogic Domain to show the domain for which you want to see the policies and select the domain.
-
Expand the domain to show the servers in that domain. Select the server for which you want to view the statistics.
-
Using Fusion Middleware Control, click WebLogic Server, and then Web Services.
-
The Web services statistics page for the server is displayed, as shown in Figure 13-2.
Depending on the types of Web services you have deployed, tabs are available for the following Web service types: Java EE, Oracle Infrastructure Web Services, and SOA.
Viewing Web Service-Specific Statistics
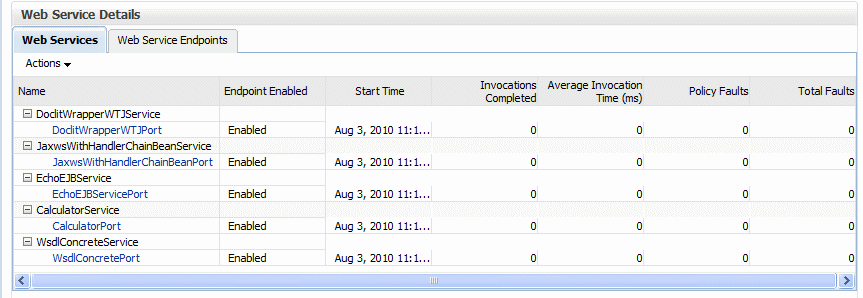
The Web Service Details section of the Web Services Summary page displays statistics on a per-Web service basis, as shown in Figure 13-3. The following statistics are displayed:
-
Name of the Web service. Click the plus sign (+) for the Web service to display the Web service endpoint.
-
Endpoint Enabled—Flag that specifies whether the Web service is enabled or disabled. For Oracle Infrastructure Web service providers, this field displays n/a.
-
Start Time—Time the Web service was started.
-
Invocations Completed—Number of completed requests to this endpoint.
-
Average Invocation Time—Average time for all Web service invocations to be processed.
-
Policy Faults—Number of failed requests because a policy was not successfully executed.
-
Total Faults—Total number of failed requests.
Figure 13-3 Web Service-Specific Statistics

Description of "Figure 13-3 Web Service-Specific Statistics"
Viewing Endpoint-Specific Operations Statistics
To display operation statistics for a particular Web service endpoint:
-
In the Web Services Details section of the Web Services summary page, select the Web Service Endpoints tab.
-
Select the endpoint for which you want to display the statistics.
The Web Service Endpoint page is displayed.
-
Select the Operations tab if it is not already selected.
The following statistics are presented for Oracle Infrastructure Web services:
-
Operation Name—Name of the operation.
-
One Way—Flag that specifies whether the operation returns a value to the calling operation.
-
Action—URI of the action.
-
Input Encoding—Encoding style of the input message.
-
Output Encoding—Encoding style of the output message.
-
Invocations Completed—Number of completed requests to this endpoint.
-
Average Invocation Time—Average time for all Web service invocations to be processed.
-
Faults—Total number of faults for this endpoint.
The following statistics are presented for WebLogic Java EE Web services:
-
Name—Name of the operation.
-
Invocation Count—Number of times that the Web service was invoked.
-
Dispatch Time Average—Average time for all Web service invocations to be processed.
-
Execution Time Average—Average time for all Web service executions.
-
Response Time Average—Average time for all responses generated.
-
Response Count—Total number of responses generated from the Web service invocations.
-
Response Error Count—Total number of errors from responses generated from the Web service invocations.
-
Viewing the Security Violations for a Web Service
Follow the procedure below to view security violations for a Web service.
To view the security violations for an Oracle Infrastructure Web service:
-
Navigate to the Web Services Summary page as described in "Navigating to the Web Services Summary Page for an Application".
-
In the Charts section of the page, select the Security Violations tab.
A graphical representation of the authentication, authorization, confidentiality, and integrity faults for all Web services in the application is displayed in the pie chart.
-
In the Web Service Details section of the page, click on the plus (+) for the Web service to display the Web service endpoints if they are not already displayed.
-
Click the name of the endpoint to navigate to the Web Service Endpoint page.
-
Click the Charts tab to see a graphical representation of all faults and all security violations for the endpoint.
-
Click the OWSM Policies tab.
Two tables are displayed.
The Globally Attached Policies table displays the name of the policy and the policy set that references it.
The Directly Attached Policies table displays the name of the policy and the policy status (whether the policy is enabled or disabled).
Both tables list the category to which the policy belongs (security, MTOM attachments, reliable messaging, WS-addressing, and management).
Table 13-1 lists the violation information provided for each type of policy attachment.
Table 13-1 Policy Violation Information for an Endpoint
Violation Type Description Total Violations
Total number of faults for this policy.
Note: Total violations may not be equal to the sum of the security violations shown below (for example, Authentication, Authorization, Confidentiality, and Integrity). Other security violations that do not fall into these major categories and non-security violations are also captured in the total violations count.
Security Violations
Authentication
Number of authentication failures since the server was restarted.
Authorization
Number of authorization failures since the server was restarted.
Confidentiality
Number of message confidentiality failures since the server was restarted.
Integrity
Number of message integrity failures since the server was restarted.
To view the security violations for a WebLogic JAX-WS Web service:
-
Navigate to the Web Services Summary page as described in "Navigating to the Web Services Summary Page for an Application".
-
In the Web Service Details section of the page, click on the plus (+) for the Web service to display the Web service endpoints if they are not already displayed.
-
Click the name of the endpoint to navigate to the Web Service Endpoint page.
-
Do one of the following, depending on the type of policies attached to the endpoint:
-
If Oracle WSM policies are attached to the endpoint, click the OWSM Policies tab.
A list of the policies that are attached to the endpoint is displayed. For each policy, the table displays the name of the policy, the policy status (whether the policy is enabled or disabled), and the category of the policy (security, MTOM attachments, reliable messaging, WS-addressing, and management). Table 13-1 describes the violation information that is displayed for each Oracle WSM policy attached to the endpoint.
-
If WebLogic policies are attached to the endpoint, click the WebLogic Policy Violations tab.
This tab shows policy violation details about WebLogic policies attached to a JAX-WS endpoint. Table 13-2 describes the information provided on this page.
Table 13-2 WebLogic Policy Violation Data
Element Description Summary
Total Faults
Total number of failed requests.
Policy Faults
Number of failed requests because a policy was not successfully executed.
Total Violations
Total number of faults for this policy.
Violations
Authentication Violations
Number of authentication failures since the server was restarted.
Confidentiality Violations
Number of message confidentiality failures since the server was restarted.
Integrity Violations
Number of message integrity failures since the server was restarted.
Successes
Authentication Successes
Number of authentication successes since the server was restarted.
Confidentiality Successes
Number of message confidentiality successes since the server was restarted.
Integrity Successes
Number of message integrity successes since the server was restarted.
-
To view the security violations for a WebLogic JAX-RPC Web service:
-
Navigate to the Web Services Summary page for the application.
-
In the Web Service Details section of the page, click on the plus (+) for the Web service to display the Web service endpoints if they are not already displayed.
-
Click the name of the endpoint to navigate to the Web Service Endpoint page.
-
Click the WebLogic Policy Violations tab.
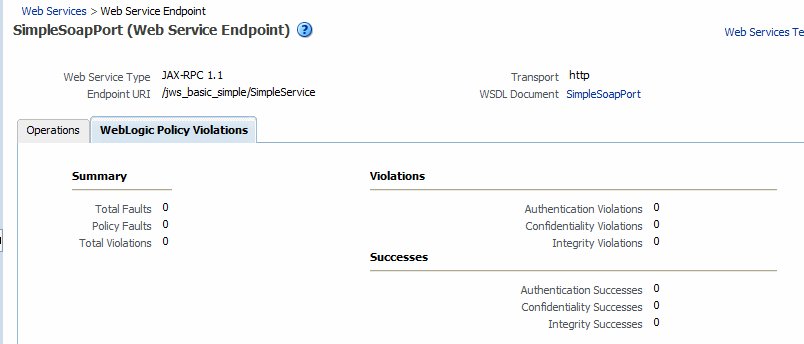
This tab shows policy violation details about WebLogic policies attached to a JAX-RPC endpoint, as shown in Figure 13-4. For a description of the information displayed on this tab, see Table 13-2.
Figure 13-4 Security Violations for a WebLogic JAX-RPC Web Service Endpoint

Description of "Figure 13-4 Security Violations for a WebLogic JAX-RPC Web Service Endpoint"
