13 Working with the Replication Monitor
This chapter describes the replication monitor page. The replication monitor page enables you to monitor and analyze TimesTen database targets that use AWT cache groups and that use replication to replicate objects to other databases.
Topics include:
Viewing the replication monitor
In order to view the replication monitor metrics, ensure that you have configured replication for your TimesTen database target and ensure that the replication agent is up.
Navigate to the TimesTen database target page. For information on navigating to the TimesTen database target page, see "Navigating to the TimesTen target page".
From the TimesTen Database Home menu, select Monitoring, then select Replication Monitor.
Analyzing information on the TimesTen replication monitor
The TimesTen replication monitor page consists of two areas each of which have been customized specifically for TimesTen replication.
The top area consists of:
The bottom area consists of five tabs:
Summary
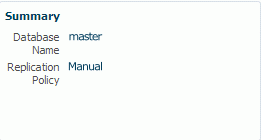
This region identifies your database and the configuration of your replication policy:
-
Database name
This value is taken from the last part of the path to the database. For example, if the path to the database is
/var/tt/master, the database name ismaster. -
Replication policy
The replication policy is set with the
-repPolicyoption of thettAdminutility. The default value is manual. For more information on changing the replication policy, see "ttAdmin" in the Oracle TimesTen In-Memory Database Reference.
Status
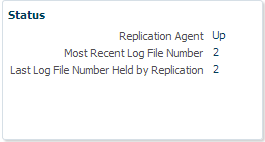
The replication status region shows overall information relative to the current state of the replicated operations. If the most recent log file number is much greater than the last log file held by replication, then the replication agent has fallen behind in transmitting the recently created transactions.
Values for Replication Agent are Up, Down, or N/A. If you have not configured a replication scheme, then the value is N/A.
State
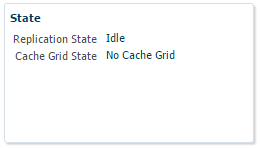
The replication state region shows the current replication state of a database in an active standby pair.
The replication state region uses values from the ttRepStateGet built-in procedure. For more information about ttRepStateGet, see "ttRepStateGet" in the Oracle TimesTen In-Memory Database Replication Guide.
Replication peers
The replication peers table is common to any database regardless of whether the database is in the role of transmitter or receiver. The table shows the list of peers to the database.
The replication peers table uses values from the TTReplication.ReplicationPEERS replication table. You can also view these values with the ttRepAdmin -showstatus utility. For more information about the TTReplication.ReplicationPEERS replication table, see "TTReplication.ReplicationPEERS" in the Oracle TimesTen In-Memory Database System Tables and Views Reference. For more information about the ttRepAdmin utility, see "ttRepAdmin" in the Oracle TimesTen In-Memory Database Reference.
Replication log holds
The replication log holds table shows information for databases that replicate transactions to other databases. The table shows replication log holds.
The replication log holds table uses values from the ttLogHolds built-in procedure. For more information about the ttLogHolds utility, see "ttLogHolds" in the Oracle TimesTen In-Memory Database Reference.
Transmitter thread status
The transmitter thread status tab shows a detailed list and status of transmitter threads for this TimesTen database. This tab is populated for databases that replicate transactions to other databases. This tab is divided into two regions:
Replication transmitters
Figure 13-6 Replication Transmitters region

Description of "Figure 13-6 Replication Transmitters region"
The replication transmitters table shows information for databases that replicate transactions to other databases. The table shows the status of transmitter threads for the database.
The replication transmitters table uses values from the ttRepAdmin -showstatus utility. For more information about the ttRepAdmin utility, see "ttRepAdmin" in the Oracle TimesTen In-Memory Database Reference.
Click a transmitter track to review the number of transactions sent on that track. The number of transactions sent in the last hour display in the transactions sent in the last hour region. For more information on the transactions sent in the last hour region, see "Transactions sent in the last hour".
Transactions sent in the last hour
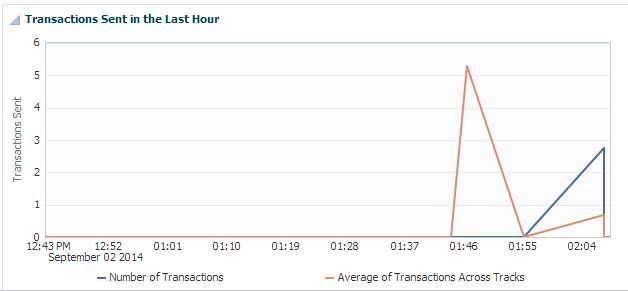
Figure 13-7 Transactions Sent in the Last Hour region
Description of "Figure 13-7 Transactions Sent in the Last Hour region"
The transactions sent in the last hour region shows a line graph with the number of transactions sent for your specified transmitter track and average number of transactions sent per transmitter track per second.
Receiver thread status
The receiver thread status tab shows a detailed list and status of receiver threads for this TimesTen database. This tab is populated for databases that receive transactions from other databases. This tab is divided into two regions:
Replication receivers
The receiver threads status table shows information for databases that receive transactions from other databases. The table shows the status of receiver threads for the database.
The replication receivers table uses values from the ttRepAdmin -showstatus utility. For more information about the ttRepAdmin utility, see "ttRepAdmin" in the Oracle TimesTen In-Memory Database Reference.
Click a receiver track to review the number of transactions received on that track. The number of transactions received in the last hour display in the transactions received in the last hour region. For more information on the transactions received in the last hour region, see "Transactions received in the last hour".
Transactions received in the last hour
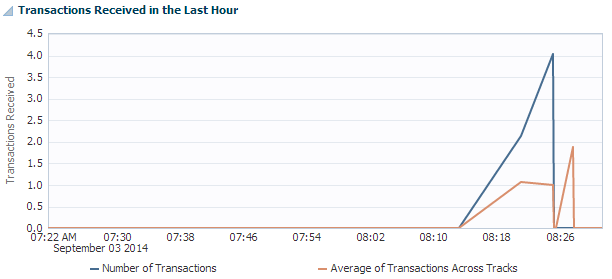
Figure 13-9 Transactions Received in the Last Hour region
Description of "Figure 13-9 Transactions Received in the Last Hour region"
The transactions received in the last hour region shows a line graph with the number of transactions received for your specified receiver track and average transactions received per receiver track per second.
Tracks
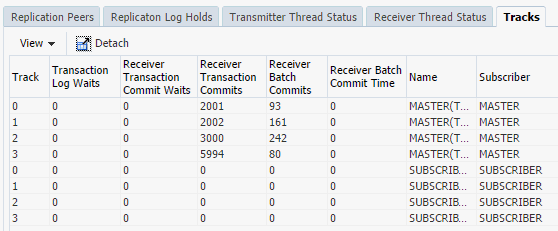
The tracks tab uses a table to show performance information about each track. This information can help you determine the location of transaction bottlenecks.
