| Oracle® Retail Analytics User Guide Release 14.1 E57810-01 |
|

 Previous |
 Next |
This chapter introduces the role of business intelligence and data warehousing in a retail environment. It briefly describes the implementation of Oracle Retail Analytics and its data sources, and the Retail Analytics user interface through Oracle Business Intelligence Enterprise Edition (Oracle BI EE).
Business intelligence includes the processes, methods, and technologies adopted by organizations to answer complex business questions and build comprehensive decision support systems. Business intelligence enables all users in a retail organization to answer questions about the business, for example:
How do actual sales this period compare to the current plan?
What is the retail value of inventory on hand, and how does it compare to the same period last year?
What are the best-selling items in a division or department?
How effective was the last promotion?
The answers to these questions and others are embedded in the enormous volume of sales and returns, price changes, receipts, and other transactions generated by your retail organization. These transactions are the raw material for business intelligence. Transaction-level data must be converted to information to support decisions in a retail enterprise.
These systems help organizations in maintaining secure, conformed, and highly available data for all levels of users, from top-level executives who make decisions based on corporate-level information to managers and analysts who analyze their areas and take actions based on their findings. Business intelligence is built using several processes, and applications that maintain these processes, using the latest tools and technologies. One of the main components of business intelligence is a data warehouse. A data warehouse is the repository that stores data extracted from multiple source systems, modeled to perform for both data loading, reporting, and ad hoc analysis needs.
The data warehouse is the central repository for the data that is required for business intelligence in a retail environment. The applications and components that make up the data warehouse perform these functions:
They organize and standardize data so that it can be stored in a consistent format in the data warehouse.
They load data to a relational database management system that is specially constructed for business intelligence.
They provide analytical tools and interfaces necessary to deliver information throughout the retail organization.
Online transaction processing (OLTP) applications, such as Oracle Retail Merchandising System (RMS), are designed for efficient record-keeping. They generally hold only a small amount of historical information. The data warehouse, on the other hand, consists entirely of historical data organized by business area. (Collections of data organized to support particular business areas are sometimes called data marts.) These business areas consist of a relatively small number of very large tables.
This type of organization is optimal in the business intelligence environment, where large quantities of historical data must be stored and made available to users in summary form. The tables that make up the data warehouse contain the information that is needed to create a picture of the organization at any point during the period for which data is kept.
Oracle Retail Analytics offers a rich business intelligence solution to retail industry users. Retail Analytics is built using latest Oracle technologies and uses Oracle Data Integrator (ODI) for extracting, transforming, and loading (ETL) the data to Oracle Business Intelligence Enterprise Edition for end user reporting and analysis. This solution provides complete, enterprise-wide insight for retail users, enabling fact-based actions and intelligent interactions.
Retail Analytics starts with customer and merchandising data. It embraces existing corporate data sources, and it integrates with Oracle Retail solutions to increase effectiveness across the entire merchandising life cycle.
Retail Analytics can integrate with Oracle applications, as well as applications from other vendors. It can be implemented alone, or integrated with other applications, to accommodate each retailer's unique information needs and applications environment. The prebuilt nature of the solution allows you to achieve fast time to value, by reducing deployment time and helping to lower total cost of ownership.
Oracle Retail Analytics is a software product that includes the following modules:
Merchandising Analytics
Customer Analytics
The Merchandising Analytics module is a merchandising-specific business intelligence module of the Retail Analytics application. It provides insight to critical performance indicators such as item sales, store performance, markdowns, inventory turns, sales and profit trends, and current and potential out-of-stocks.
Merchandising Analytics dashboards provide the ability to act on those insights. They enable you to order more stock, reallocate merchandise, or begin a promotion, triggered by metric thresholds.
The Customer Order subject area of the Merchandising Analytics module facilitates analysis of Oracle's Commerce Anywhere solution. Commerce Anywhere integrates Oracle Retail applications with on-line order capture (OOC) and order management (OMS) applications to support the ability to do real-time available inventory lookups into Oracle Retail applications, creation of customer orders fulfilled from suppliers or retailer locations, and fulfillment of these customer orders.
The Customer Analytics module enables you to perform retail analysis of customers and customer segments. It features three new subject areas:
Customer Analysis
Market Basket Analysis
Promotion Analysis
For each subject area, there are relevant metrics that can be used to answer business questions such as the following:
Who are my most profitable customers? Who are my most frequent shoppers?
Which items in my category should I promote together? Which items cannibalize sales from others?
How did my promotion perform compared to my plan? How profitable was it?
How are my products selling across various customer demographics?
How are my products selling across various customer behaviors?
Which items should I promote, and using which methods?
What are my top product affinities?
What is my promotional lift?
The Customer Analytics module provides fact-based insight into the following:
Customer price sensitivity
Customer loyalty to merchandise
RFM scores
Overall promotion effectiveness
You can use this insight to manage and track event performance, and to segment and retain your most valuable customers. You can assess the effectiveness of promotions, track and analyze key promotion sales and promotion metrics, and generate a complete picture of customer-centric promotion performance.
Customer segment analysis in Customer Analytics is available based on the following:
Demographics, the ability to analyze segments by income, ethnicity, geography, and other factors.
RFM scoring, used for analyzing customer behavior and defining market segments. The following metrics are given a score of 1 through 5:
Recency – How recently did the customer purchase?
Frequency – How often does the customer purchase?
Monetary value – How much does the customer spend?
Behavior – Are customers considered environmentally green? Would they be considered frugal? Do they tend to be health-conscious? Based on their behavioral attributes, you can make informed decisions about products or promotions that are of interest to your customers.
Customer loyalty analysis and scoring – Retail Analytics provides the ability to classify and report on customers by loyalty score.
Market basket analysis offered by the Customer Analytics module provides insight into which products might make effective bundles. Customer behavior information is obtained from mining transaction history, and it is correlated with customer segment attributes to inform promotion strategies. The ability to understand market basket affinities allows marketers to calculate, monitor, and build promotion strategies based on critical metrics such as customer profitability.
Promotion analysis can be done based on the following:
Promotional halo and cannibalization, which will highlight the promotions effect on other items in the category.
Promotional try and repeat, which shows the promotion's effect on initial and repeat purchases.
Promotional response rate and offer conversion, which will speak to the effectiveness of the promotion.
These are some characteristics of Oracle Retail Analytics:
Rich reporting capabilities
Retail Analytics offers report creation capabilities using three different analysis methods in the same environment:
Historical (as-was)
Current (as-is)
Point in time
See Chapter 4, "Creating and Modifying Reports" for more information about these analysis methods.
Packaged reports are provided as a reference for creating customized reports and serve as the baseline reports for Retail Analytics.
Comprehensive Solution
Oracle Retail Analytics is an end-to-end solution for reporting and retail business intelligence needs through the following:
Data integration with source applications
Loading and transforming the fact and dimension data
Rolling up the data for improved query performance
The Web-based Oracle BI user interface for report creation
Shell scripts for setting up the batch schedule
An automated installer
High-performance extract, transform, and load (ETL) code
Using Oracle Data Integrator, Retail Analytics offers high performance for the Oracle Database batch processes.
Extensibility
Retail Analytics ETL code can be customized and extended for customer-specific needs.
Flexibility
Oracle Data Integrator and Oracle BI EE code promote flexibility during implementation based on customer-specific needs and help in improving batch and report performance.
High-performance reporting
Retail Analytics metadata is built using Oracle BI EE and designed to perform in complex reporting scenarios.
Robust data model
The Retail Analytics data model is designed to support a retailer's data needs in a business intelligence environment. Data model elements are designed to perform with Oracle BI EE architecture.
Retail Analytics uses several data sources including Oracle Retail Merchandising System (RMS) and Oracle Retail Price Management System (RPM). Data is extracted, loaded, and transformed into the Retail Analytics data model to support reporting requirements. The first step after installing Retail Analytics is to load the data into data warehouse tables using packaged Oracle Data Integrator ETL programs.
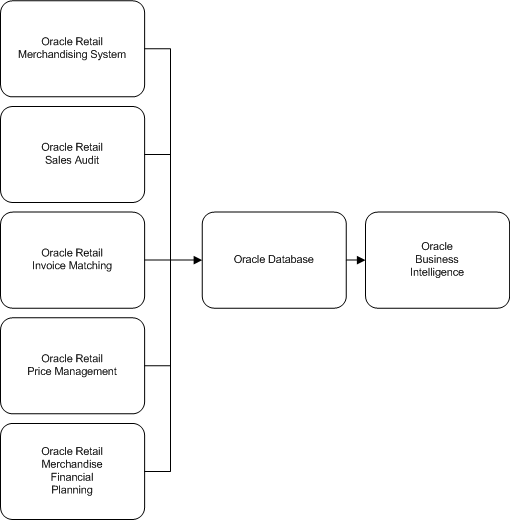
Figure 1-1 illustrates the data sources for Oracle Retail Analytics. The data sources can be Oracle Retail applications or other data sources specific to each retailer's systems environment. The Customer dimension has an external customer stub, or open interface, so that you can bring in customer data from sources other than Oracle Retail applications.
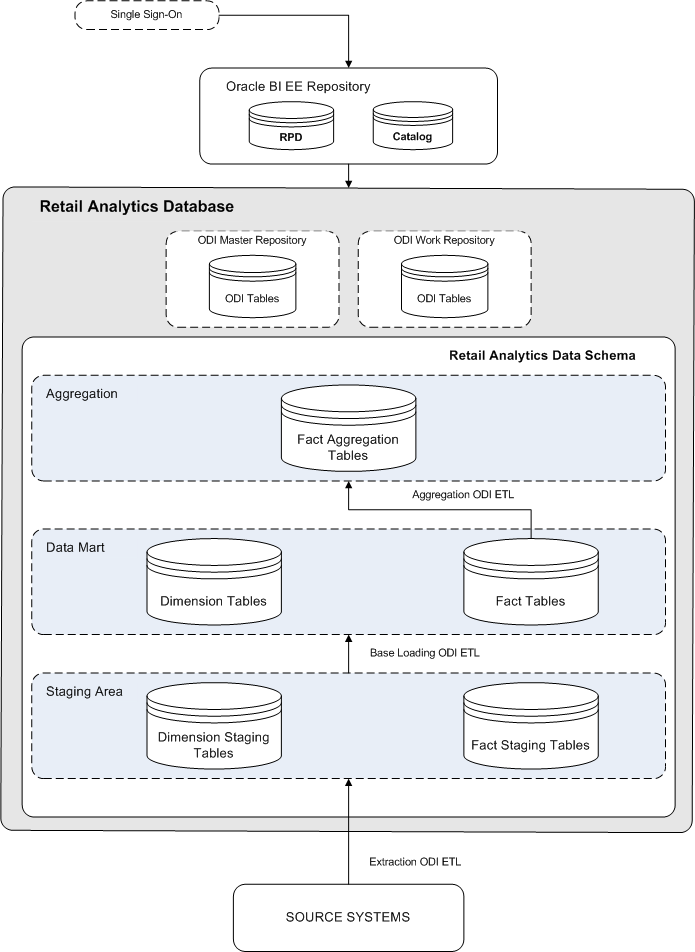
Figure 1-2 represents how the Oracle Retail Analytics data model interfaces with other Oracle Retail Applications, and how an Oracle BI user accesses the Retail Analytics metadata. See the Oracle Retail Analytics Implementation Guide and Oracle Retail Analytics Data Model for more details about the data model.
Oracle Retail Analytics is integrated with the following Oracle Retail applications:
Oracle Retail Merchandising System (RMS)
Oracle Retail Sales Audit (ReSA)
Oracle Retail Invoice Matching (ReIM)
Oracle Retail Price Management (RPM)
Oracle Retail Merchandise Financial Planning (MFP)
See the Oracle Retail Analytics Installation Guide for information about the release levels of Oracle Retail products that integrate with Oracle Retail Analytics.
An online transaction processing (OLTP) application such as Oracle Retail Merchandising System (RMS) is the principal source of data for Retail Analytics. The OLTP application provides the majority of attribute data for most dimensions, including organization, product, and time calendar dimensions. The OLTP application supplies facts for many data marts including inventory, pricing, cost, and supplier compliance. For more details, see the Oracle Retail Analytics Operations Guide, which maps source data to its corresponding target table in Retail Analytics.
Oracle Retail Sales Audit (ReSA) provides the tools to evaluate point-of-sale data, to ensure the accuracy and completeness of information exported to downstream systems used in optimization processes, financial reporting, and analysis.
Oracle Retail Invoice Matching (ReIM) is a solution that provides the data necessary to support invoice verification, minimizing interface development and maintenance costs. ReIM can serve as the source of invoice cost data. This information must be extracted from another application if you do not use ReIM.
Oracle Retail Price Management (RPM) is a solution that assists with pricing decisions. RPM can serve as the source of promotion data. This information must be extracted from another application if you do not use RPM.
Oracle Retail Merchandise Financial Planning (MFP) provides strategic and financial product planning functions. These functions support industry planning standards for preseason and in-season processes. MFP facilitates the creation of financial plans in a structured method.
Data granularity is decided for fact tables based on reporting requirements. Currently, data granularities are set for generic report requirements. Data may be available at lower levels in source systems and may not be available in Retail Analytics because of requirements. Dimension data exists at the lowest hierarchy levels.
The data from transaction systems is transformed to accommodate the Retail Analytics database structure. This data serves as the foundation for business measurements, but by itself it is not sufficient to answer many business questions.
Typically, data is held at a low granular level in Retail Analytics. For example, sales data is held by location, item, and day attributes. There is one row in the sales fact table for every combination of these attributes. In most cases, however, the analyst wants to view data at higher levels in the product and organization hierarchies, and for a longer span of time than a single day.
Effective business intelligence requires facts to be held at a low granular level, while allowing measurements at any level in the organization where they are needed. For example, a location manager making an assessment of monthly sales at the department level wants a report showing total sales for each department. When the location manager spots a potential problem at the department level, the manager may want to focus analysis on the subclass, or even the specific items, for which problems exist. Retail Analytics permits analysis at any level by storing information at a low granular level, while allowing reporting at higher summary levels.
In some cases, Retail Analytics holds data at multiple levels, to facilitate analysis and improve performance. For example, sales facts are held by subclass and week, as well as by item and day (the location attribute is present in both tables). The result is that the same data exists in more than one fact table in the database. While redundant data improves performance by reducing the number of queries that must be serviced, it also requires more maintenance. Retail Analytics uses redundant data in a few cases in which all customers benefit in terms of performance; in most cases, however, retailers must determine where redundancy is needed, based on their own requirements.
The Oracle Retail Analytics presentation model is implemented in the form of seven subject areas. (A subject area is also called a presentation catalog in the repository.) The following are the categories of subject areas in Retail Analytics:
Merchandising Analytics
Merchandising Analytics is supported for sales and sales promotion, supplier, product, employee, and organization for as-is, as-was, and point in time analysis.
Customer Analytics
The Customer dimension is supported for sales, sales promotion, customer loyalty, and promotions for as-is, as-was, and point in time analysis. Market basket analysis is supported for as-is analysis only.
The subject areas are as follows:
Retail Merchandising Analytics As-Was
Retail Merchandising Analytics As-Is
Retail Merchandising Analytics Point in Time
Retail Customer Analytics As-Was
Retail Customer Analytics As-Is
Retail Customer Analytics Point in Time
Retail Customer Analytics Data Mining
See Appendix B, "Reporting on Oracle BI Repository Objects," for information about how to produce documentation about repository objects.
As-Was
The supporting attributes and metrics for as-was reporting are available in this subject area. On the reports on this subject area, the historical data is associated with the hierarchy of an attribute before a reclassification. For example, if an item is reclassified from the Snacks Department to a new Grocery Department, the previous history of the item stays with the old department (Snacks), which shows how the SKU performed in that department. Future transactions for the item will belong to its new department (Grocery).
As-Is
The supporting attributes and metrics for as-is reporting are available in this subject area. On the reports on this subject area, historical data is associated with the new hierarchy of an attribute after a reclassification. For example, if an item is reclassified from the Snacks Department to a new Grocery Department, the previous history of the item moves to the new department (Grocery).
Point in Time
The supporting attributes and metrics for point-in-time reporting are available in this subject area. On the reports on this subject area, historical data is associated with the hierarchy of an attribute as of a user-supplied date. For example, if an item is reclassified from the Snacks Department to a new Grocery Department on January 15, 2013, and a report is run for February 16, 2013, the previous history of the item before January 15, 2013 is reported in its new department (Grocery).
Data Mining
Market Basket Analysis metrics are generated through a complex data mining process. To realize their maximum value, you should use them in specific ways that differ from other Oracle Retail Analytics metrics. See the "Market Basket Analysis" section of Chapter 3, "Predefined Retail Analytics Reports" for a description of the data mining process.
For example, Market Basket Analysis reports have been designed so that their metrics are specific to each report and cannot be used across reports. Market Basket reports can be customized by adding or removing relevant metrics, but only those metrics that belong to that report can be added. It is not accurate to drill down or roll up on Market Basket attributes. By observing these guidelines, you can be sure that you are analyzing your Market Basket metrics in the appropriate context.
Oracle BI is the interface that provides the OLAP tools for Oracle Retail Analytics. Oracle BI is a comprehensive solution that you can use to create, modify, schedule, and distribute reports to end users throughout your retail enterprise. You access Oracle BI through your Web browser. Oracle BI is the metadata built on top of the Retail Analytics data model, and it can be used for executing and scheduling existing reports or creating ad hoc reports.
For information about creating reports with Oracle BI, the primary reference is the Oracle Fusion Middleware User's Guide for Oracle Business Intelligence Enterprise Edition.
The Oracle BI interface can be customized in many ways for your enterprise. The illustrations in this guide show the default installation of Retail Analytics dashboards and reports. You can create your own dashboards to organize your reports and other objects you create. You can also develop report schedules and automated distribution mechanisms, to direct reports to the people who need them.
|
Note: The specific URL and login requirements for Oracle BI depend on how Oracle BI is configured in your enterprise. Your system administrator can supply the information you need to access Oracle BI and Retail Analytics. |
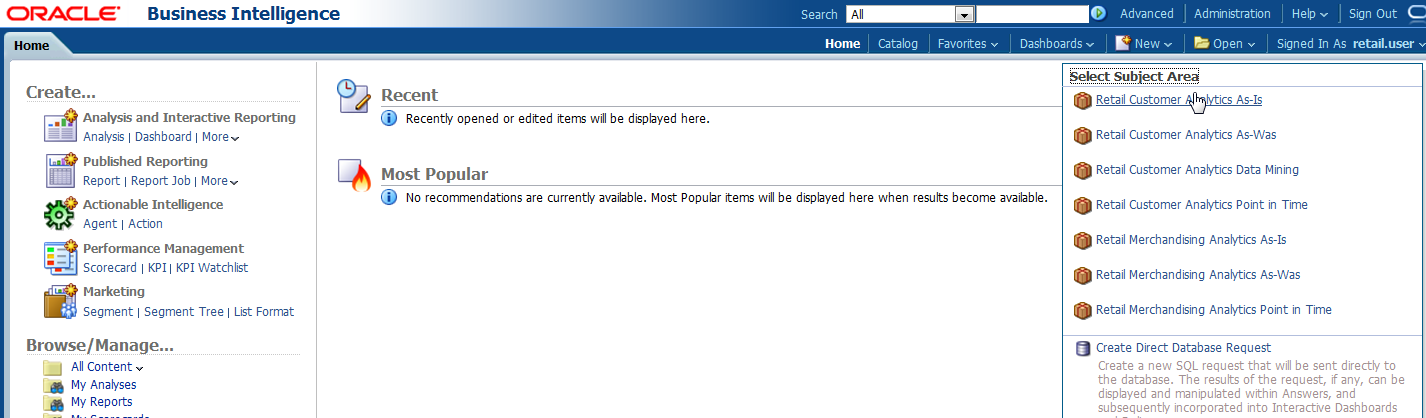
Figure 1-3 shows an example of the interface you use to create and modify reports.
Use the Oracle BI Presentation interface for tasks such as the following:
To create and modify reports, prompts, and filters
To perform ad hoc analyses and experiment with metrics and filters
To experiment with different report presentations, including tables and charts of many types
To schedule and distribute finished reports to the end users who need them
To administer presentation layer security, which limits the reports, dashboards, and report elements users can access
The Oracle BI interface displays attributes, facts, and metrics as logical columns. When a report is executed, the results (rows of data) are grouped by the attribute columns on the report, such as ’Sales $ by Year, Department.' You can include any of the logical columns in your reports. You can modify your report columns with your own metrics, filters, and prompts.
Numerous predefined reports are packaged with Retail Analytics and can be used without modifications. You can also enhance these reports for your specific requirements and use them to create your own custom reports. For more information about predefined reports, see Chapter 3, "Predefined Retail Analytics Reports."
Retail Analytics is built with role-based access. Permissions are associated with roles. Users should be made members of appropriate roles, through which users acquire the permissions needed for their jobs.
The following groups and application roles are available:
Buyers
Buyer analysts
Inventory analysts
Inventory managers
Merchandising executives
Merchandise financial planners
Planning executives
Promotional planners
Pricing analysts
Retail Analytics developers
Oracle BI provides numerous language options for users; however, not all languages supported by Oracle BI are supported by Oracle Retail Analytics. The following languages are supported for Retail Analytics users:
Chinese (Simplified)
Chinese (Traditional)
Croatian
Dutch
English
French
German
Greek
Hungarian
Italian
Japanese
Korean
Polish
Portuguese (Brazilian)
Russian
Spanish
Swedish
Turkish
Use the Oracle BI Administration interface for tasks such as the following:
Create and modify metrics, attributes, and dimensions
Create and modify subject areas (presentation catalogs)
Create and modify users and their privileges
Add new tables to the physical layer or modify the existing relations
These tasks should be performed by Oracle BI developers and administrators, because they require coding and testing. For more information about Oracle BI administration, see the Oracle Fusion Middleware System Administrator's Guide for Oracle Business Intelligence Enterprise Edition.
To support numerous business decision-making processes, Retail Analytics reports are designed for different categories of users such as:
Merchandising executives and analysts
Buyers
Pricing executives and analysts
Planning executives and analysts
Inventory control managers
In the standard Retail Analytics installation, the predefined reports are organized in multiple dashboards to facilitate role-based implementation.
See the Oracle Fusion Middleware Security Guide for Oracle Business Intelligence Enterprise Edition to learn about authentication and user role configurations for an enterprise.
|
Note: Retail Analytics does not provide data level security. |
For each dashboard, additional measures can be inserted into the existing reports or used to create custom reports based on specific business requirements. These additional measures are available in each application's subject area in Oracle BI Answers. For more information on creating custom reports, see the following:
Oracle Retail Analytics Implementation Guide
Oracle Fusion Middleware User's Guide for Oracle Business Intelligence Enterprise Edition
Oracle Fusion Middleware Metadata Repository Builder's Guide for Oracle Business Intelligence Enterprise Edition