6 Troubleshooting Oracle Database Appliance Plug-in
Troubleshooting tips and techniques for the Oracle Database Appliance plug-in include the following items.
6.1 Host Discovery Troubleshooting
For problems with host discovery check the following solutions:
6.1.1 Prerequisite Check Failure
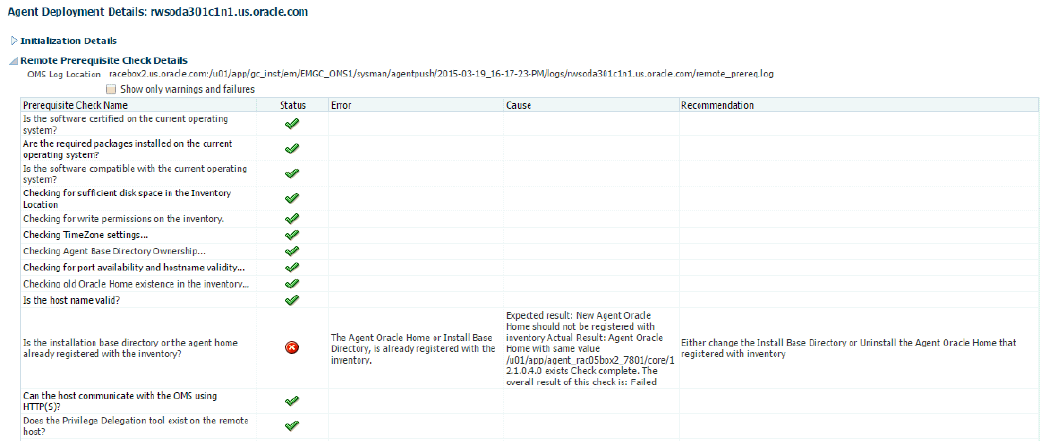
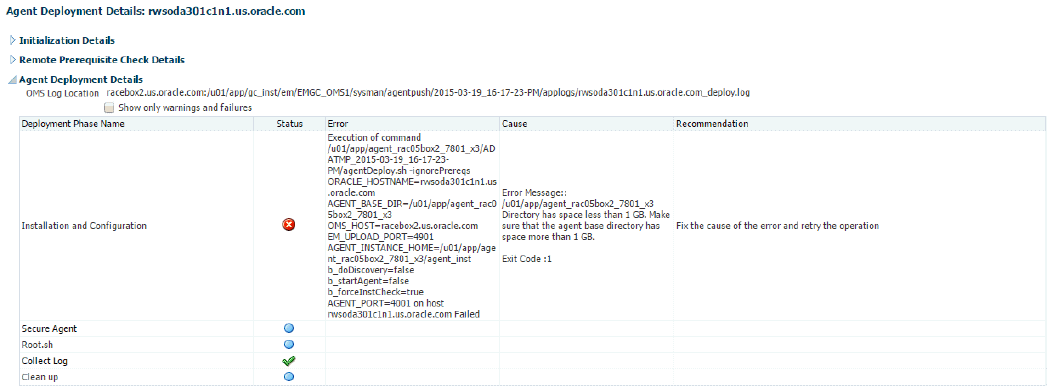
Possible causes for the prerequisite check failure are displayed in the Agent Deployment Details page as shown in the following figure. Recommended solutions are given in the page.
Figure 6-1 Agent Deployment Errors and Solutions
Description of "Figure 6-1 Agent Deployment Errors and Solutions"
Figure 6-2 Agent Deployment Errors and Solutions
Description of "Figure 6-2 Agent Deployment Errors and Solutions"
6.1.2 Host Discovery is Done Without Enabling the Root Privileges
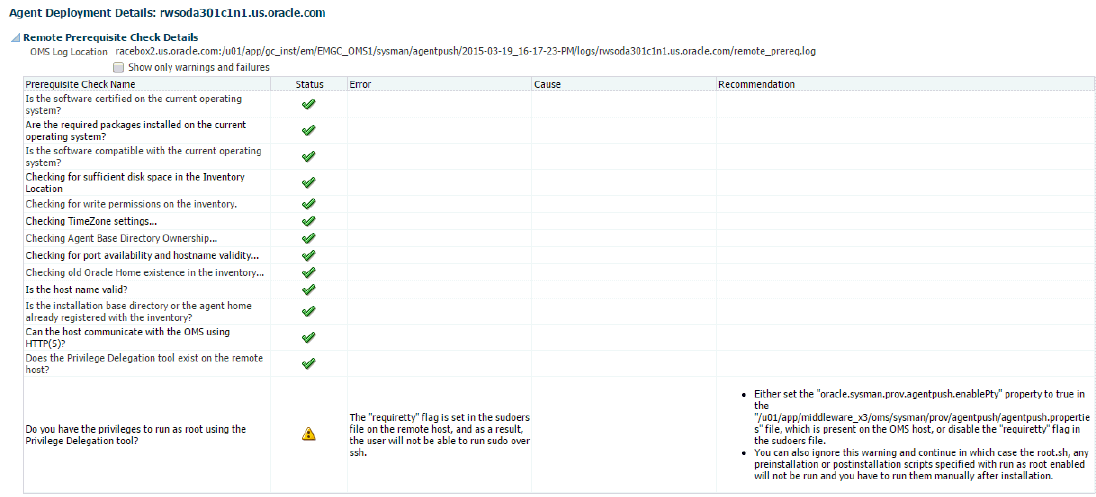
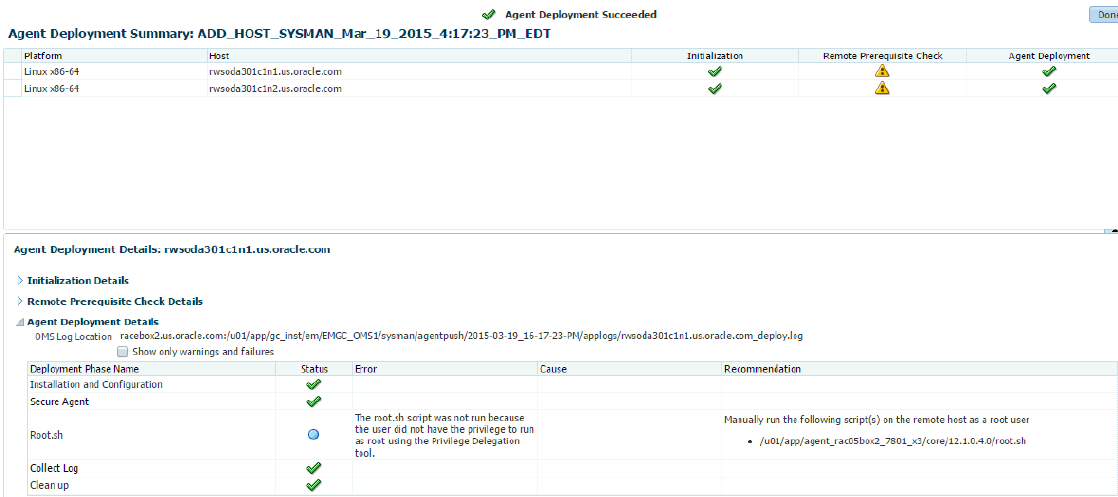
Failure to run root.sh manually results in metric collection failure. The Agent Deployment Details page displays the following:
Figure 6-3 Agent Deployment Errors and Solutions
Description of "Figure 6-3 Agent Deployment Errors and Solutions"
Figure 6-4 Agent Deployment Errors and Solutions
Description of "Figure 6-4 Agent Deployment Errors and Solutions"
If the warning is ignored during the host discovery, the root.sh script that exists on the remote host must be run manually after agent deployment is done.
6.2 Oracle Database Appliance Discovery Troubleshooting
Very often, the error message itself will include the cause for the error. Look for error messages in the OMS and agent logs (case insensitive search for odadiscovery) or in the guided discovery flow itself.
Check the following solutions:
6.2.1 Discovery Requires Root User
Oracle Database Appliance discovery must be done by the root user. As part of any discovery troubleshooting, possible causes can include:
-
Some other user is given to perform the discovery
-
An incorrect root password was entered
6.2.2 File /opt/oracle/oak/onecmd/onecommand.params Required
The file /opt/oracle/oak/onecmd/onecommand.params is required as prerequisite for guided discovery. As part of any discovery troubleshooting, possible causes can include:
-
The onecommand.params file is missing or not accessible
-
Some of the fields in onecommand.params file are missing. This can be fixed on the Discovered Targets page where the user can manually enter all the required information.
6.3 Metric Collection Error After Discovery
For problems with metric collection found after discovery, check the following solutions:
6.3.1 Plug-in Versions Do Not Match
Verify that the agent side plug-in version matches the OMS side plug-in version.
6.3.2 Plug-in Version is Not the Same on the Two Host Nodes
Verify that the plug-in version is the same on both of the host nodes.
To check the Enterprise Manager Oracle Database Appliance Plug-in versions on the OMS and agents:
-
Open the Enterprise Manager Setup menu and select Extensibility, the choose Plug-ins.
-
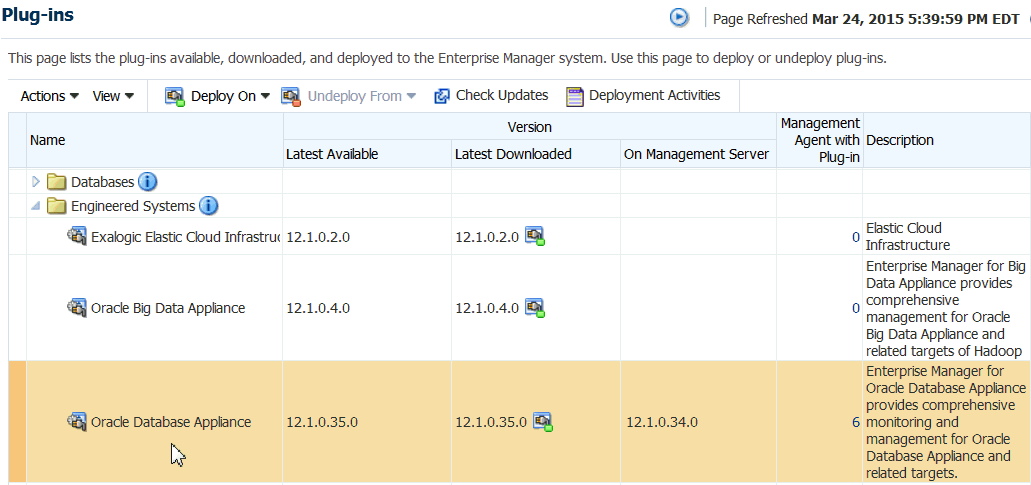
On the Plug-ins page expand the Engineered Systems folder and find the Oracle Database Appliance row as shown below.
Description of the illustration trouble_version.gif
The Latest Downloaded column shows the version uploaded to Enterprise Manager repository.
The On Management Server column shows the plug-in version deployed on the Management Server.
-
If the value in the Management Agent with Plug-in column is non-zero, click on the number.
A page opens which lists the agents that have the plug-in, and the Plug-in Version on Management Agent column shows the plug-in version deployed on the agent.
6.3.3 Monitoring Credentials Set Incorrectly
Verify that the monitoring credentials were set correctly.
-
Log in to Enterprise Manager.
-
Click Setup, then Security, and then Monitoring Credentials.
-
On the Monitoring Credentials page, click the Oracle Database Appliance Manager target type, then set the monitoring credentials.
6.4 Oracle Database Appliance ECM Configuration Data Troubleshooting
This data is scheduled to run the collection every 24 hours by default. To check for data availability and last collected time:
-
From the Enterprise Manager Cloud Control console:
-
Click Targets, then All Targets.
-
Click the Oracle Database Appliance Manager target from the list.
-
Click Configuration, and choose the Last Collected option.
-
On the Latest Configuration page, click Actions, then Refresh.
-
-
From the command line run:
# emctl control agent runCollection
# target_name:target_type <collectionName>
-
You can also verify that ECM data are collected and presented in Enterprise Manager Repository using SQL plus.
6.5 OAK-Based Metric Collection Troubleshooting
Oracle Database Appliance is a multi-agent target like Oracle RAC. At a given point in time, Oracle Database Appliance is monitored by only one node's agent, which is the master agent. OMS determines which node's agent will do the actual monitoring, and this is referred to as the OMS mediated target. The data displayed in the Oracle Database Appliance Target Navigation page is based on the OAK metric collection from the node running the master agent.
6.5.1 How to Determine Which Node Agent is Monitoring the Oracle Database Appliance Machine
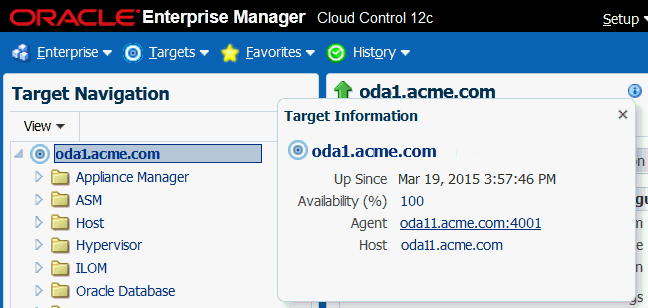
To determine which node agent is monitoring Oracle Database Appliance, click on the information icon next to Oracle Database Appliance machine name in the Oracle Database Appliance Target Navigation page as shown below.
There are many ways to access the page. In this example we start from the Enterprise Manager Targets menu.
-
Open the Enterprise Manager Target menu, and select All Targets.
-
In the All Targets page, in the navigation tree, find and expand the Engineered Systems category.
-
Select Oracle Database Appliance System.
-
Click the information icon next to the Oracle Database Appliance machine name in the target page to display the Agent name.
Description of the illustration trouble_agent.gif
6.5.2 Viewing OAK Metrics
-
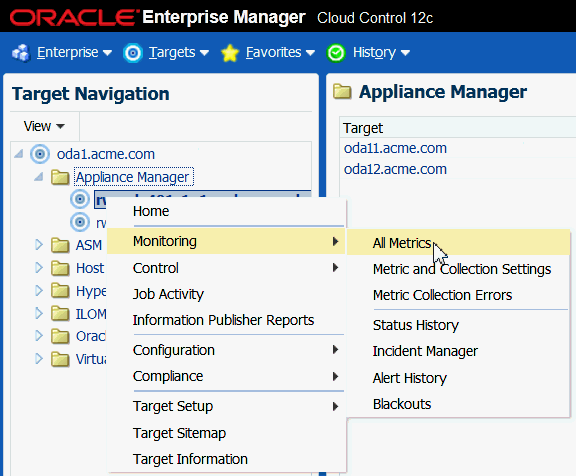
Right click on an OAK target under Appliance Manager, then select Monitoring, then All Metrics.
Description of the illustration trouble_metrics.gif
-
Choose a metric to see details.