


| |
Before you begin
To display details about the instrumentation event associated with a method invocation:
The event details are displayed in the panel below the call tree, as shown in the following figure.
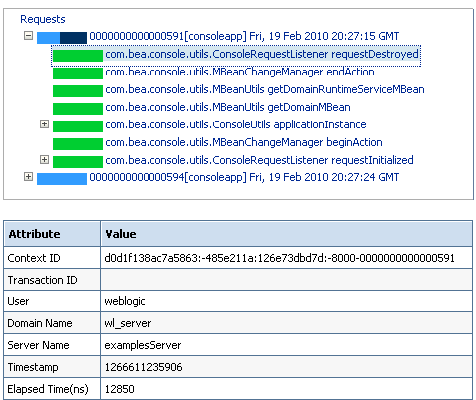
The attributes listed in this panel are described in the following table.
| Attribute | Description |
|---|---|
| Context ID | Diagnostic context information to correlate messages coming from a specific request or application. |
| Transaction ID | The identifier for the transaction that initiated this diagnostic event. Present only for messages logged in the context of a transaction. |
| User | The user ID under which this diagnostic event was executed. |
| Domain Name | Domain in which this event was generated. |
| Server Name | The name of the WebLogic Server instance on which this event was generated. |
| Timestamp | Date when this event was generated. |
| Elapsed Time(ns) | Elapsed invocation time, in nanoseconds, of the selected method |
| Elapsed Time(%) | Elapsed invocation time of the selected method as a percentage with respect to overall elapsed invocation time of the parent method |
| Scope Name | Server or application scope in which this diagnostic event was generated. |
| Module Name | Diagnostic module through which this diagnostic event was generated. |
| Monitor Name | Diagnostic monitor that triggered this diagnostic event. |
| File Name | Name of the Java file containing the instrumented method that generated this diagnostic event. |
| Line Number | Line in the source file where instrumented code exists. |
| Class Name | Name of the Java class containing the instrumented method. |
| Method | Name of the instrumented method that generated this diagnostic event. |
| Method Signature | The signature of the method that generated this diagnostic event. |
| Context Payload | The diagnostic context payload associated with diagnostic event. |
| Dyes | The diagnostic dyes associated with the method that initiated this event. |
| |