Oracle® Insurance Rules Palette
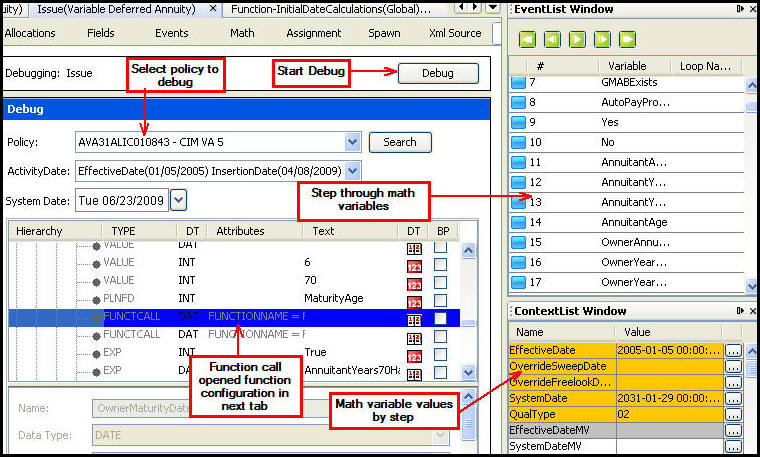
The Debug pane is a tool that can be used to debug errors in the math section of a transaction. This tool moves through execution steps in sequence and displays all math variables and their associated values at each step. Debugging not only walks through the transaction’s configuration but automatically opens any called functions and steps through all of the math variables and displays values according to what was passed in from the transaction configuration.
Before using the debug feature make sure remote debugging is set-up in the Rules Palette.
Steps to Check Remote Debugging in Rules Palette
Right-click on the environment connection in the Main Explorer tab.
Select Properties. The Properties Window will open.
Scroll down to the row for the Debug Web Service URL.
Click the button to the right of the field. An Environment Properties window will open for the Debug Web Service. The URL should be listed.
To start a debug session, navigate to the transaction you want to debug. Make sure the transaction is checked-in. Then go into the OIPA application and apply the transaction to an active policy. The transaction should remain in a pending status. Go back to the Rules Palette and set the debug parameters from the Debug pane. The EventList window steps through the math variables and the ContextList window displays the current state of each variable throughout the debug session.
All translation, compilation and runtime errors must first be fixed in order to use the Debug pane. Debug can be performed when the transaction is checked-in or checked-out; however, configuration problems can only be fixed if the transaction is checked out.
Debug Pane and Related Windows
Steps to Start a Debug Session
Double-click on the transaction's XML file.
Open the Debug pane.
Select a policy from the policy drop-down box. The transaction must be a pending activity attached to an active policy.
If debug is performed on a transaction without selecting a policy, an exception will occur.
Select the ActivityDate if the activity is applied more than once on the policy.
Select the SystemDate if necessary.
Click Debug. If the initiation of the debug session was successful, a success message will display. Click OK.
Initiate a debug session using the steps above.
Click Run or Fast Forward to execute each step to the end of the math or to the next breakpoint.
OR
Click Step Forward to move forward one step in the math.
Use Rewind to return to the beginning of the debug session or Step Backward to go back one step in the debug session. The Variable Indicator will step to an instruction, either forward or backward as the previous selection dictates.
In the EventWindow a blue ![]() and green
and green ![]() button appears next
to the math variable execution steps. The blue
button indicates the math variable is part of the transaction. The
green button indicates the math variable is part of a called function.
Double-click on either button to be brought to
the math variable in the transaction or function configuration.
button appears next
to the math variable execution steps. The blue
button indicates the math variable is part of the transaction. The
green button indicates the math variable is part of a called function.
Double-click on either button to be brought to
the math variable in the transaction or function configuration.
The remote debugger does not debug Function rules separately, only as called within a transaction.
Use the
ContextList Window to view the state of the math variable at each step
in the debug session. If the value does not fully
display in the column, click the ellipsis (...) button to see the full
details. When a Valuation element is debugged, a dollar sign icon is available instead of the ellipsis button. Clicking it will open a Policy Valuation window that displays valuation and fund information.
The Debugger will not display the values of MathUpdate math variables or the field itself.
Another debugging feature is the ability to set-up breakpoint(s) in
the configuration. Breakpoints are places in the code where execution
is stopped for debugging purposes. In the Rules
Palette, select as many breakpoints as needed by checking the BP checkbox.
After breakpoints are selected, use the play button
![]() in EventList window to step through configuration.
in EventList window to step through configuration.
Important: Breakpoints
can be set for a loop that then displays math variables and associated
values for each iteration of the loop. Use the play button ![]() to step through each iteration of a loop.
to step through each iteration of a loop.
Breakpoint Column on Debug Pane
To clear all the breakpoints, select the Clear All ![]() button.
button.
Copyright © 2009, 2012, Oracle and/or its affiliates. All rights reserved. Legal Notices