Accessing Debugging Mode
The Debug mode is a built in mechanism used to track down unexpected application behavior. You enable and disable debug mode for the current page and session by clicking the Debug and No Debug links in the Developer Toolbar. To view Debug reports, click the View Debug link in the Developer Toolbar.
Description of the illustration d_toolbar.gif
See Also:
"About the Developer Toolbar"Enabling and Disabling Debugging
You enable and disable debug mode at the application-level using the Debugging attribute on the Edit Application Definition page.
To enable or disable debugging:
-
On the Workspace home page, click the Application Builder icon.
-
Select an application.
-
Click the Edit Application Properties button to the right of the application name.
The Edit Application page appears.
-
Scroll down to Properties.
-
For Debugging:
-
Yes. Enables the application debug mode using the browser at runtime.
-
No. Disables the application debug mode using the browser at runtime.
-
See Also:
"About Application Attributes"Running an Application in Debugging Mode
You run and disable debug mode at runtime by clicking Debug and No Debug on the Developer Toolbar. By default, Debugging mode is disabled. See "Enabling and Disabling Debugging".
To enable or disable Debug mode:
-
On the Workspace home page, click the Application Builder icon.
-
Run the application.
-
On the Developer Toolbar, click Debug.
The debugging mode is enabled. Debug data is captured in the background.
-
To disable debug mode, on the Developer Toolbar, click No Debug.
Using f?p Syntax to Access Debugging Mode
You can also use f?p syntax to run an application in Debugging mode. Simply call the page and set the Debug argument to YES. For example:
f?p=100:1:&APP_SESSION.::YES
See Also:
"Using f?p Syntax to Link Pages"Viewing Debug Reports
To view a debug reports:
-
On the Workspace home page, click the Application Builder icon.
-
Select the desired application.
You can view debug reports when the application is running or in development mode.
-
To view a debug reports in development mode:
-
Click the Find icon and then the Debug tab. See "Using the Find Icon".
-
On the Application home page, click Utilities, and then Debug Messages.
-
-
To view debug reports when the application is running, click View Debug on the Developer Toolbar.
A list of Debug reports displays.
-
Click the View Identifier to the left of the session you want to view.
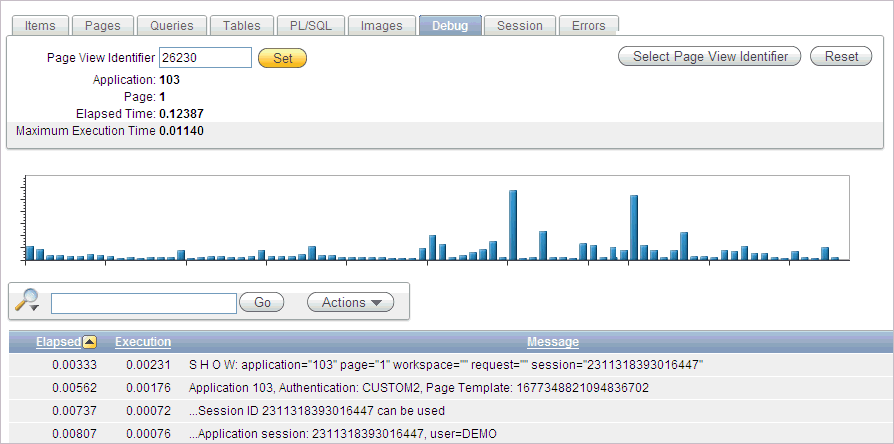
The following illustration shows debug reports viewed in the Item Finder.

Description of the illustration debug_report.gif
-
To view steps that took the longest, hover over that step on the graph above the report.
The step details display.
-
To go to that step in the report, click on the bar.
Note:
Debug sessions listed in the report live for at least 2 weeks and age out along with the activity log. This is usually more than adequate for debugging purposes.