About Adding Data Grids
Data grids are sets of data displayed in rows and columns. Data grids store data in a similar way to how spreadsheets store data. Once created, the structure can be modified as needed over time.
About Data Grids
You can define the structure of a data grid using column names, data sources, and basic validations, or you can create a data grid by pasting spreadsheet data. Once created, the structure can be modified as needed.
Users can alter the layout of report data by selecting columns or by applying filters, highlighting, and sorting. Users can also define breaks, aggregations, group bys, computations, and different charts. Additionally, users can create multiple variations of a data grid and save them as named reports, for either public or private viewing. In addition to being available under the View menu, data within a data grid can be included as a chart or report within any page.
See Also:
"About Chart Sections"Creating a Data Grid
You can create a data grid by either defining the structure (that is, the column names, data sources, and basic validations), or by pasting in spreadsheet data. In addition to the defined columns, the following standard columns are always included within each data grid: owner, created by, created on, updated by, updated on, row order, and annotation (files, notes, links, and tags).
Creating a Data Grid from Scratch
When you create a data grid from scratch you must define the column names, data types, and basic values. Once you have created the basic structure, you can then populate it with data.
To create a data grid from scratch:
-
Run the Websheet application. See "Running a Websheet".
-
From the Create menu, select New Data Grid.
Tip:
You can also select New Data Grid on the Control Panel. -
When prompted for the section type, select From Scratch and click Next.

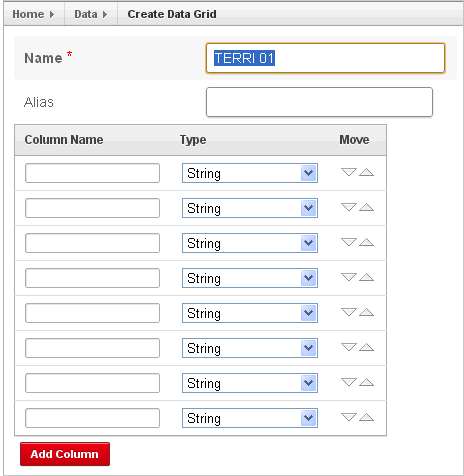
Description of the illustration data_grid_srcatch.gif
-
Specify the following:
-
Name - Enter a data grid name.
-
Alias - Enter a data grid alias. Use this alias to link to this data grid within other page sections. A data grid alias must be unique within an application.
-
Define the data grid structure by specifying the column name and data type. To change the order, click the Up and Down arrow under Move.
To add more columns, click Add Column.
-
Click Create Data Grid.
The Data Grid appears.
-
-
To add data, click Add Row. See "Editing Data Grid Data".
Creating a Data Grid by Copying and Pasting Spreadsheet Data
To create a data grid by copying an pasting spreadsheet data:
-
Run the Websheet application. See "Running a Websheet".
-
From the Create menu, select New Data Grid.
Tip:
You can also select New Data Grid on the Control Panel. -
When prompted for the section type, select Copy and Paste and click Next.
-
Specify the following:
-
Name - Enter a data grid name.
-
Alias - Enter a data grid alias. You can use this alias to link to this data grid within page sections. A data grid alias must be unique within an application.
-
First Row Contains Column Headings - Select this option if applicable.
-
Paste Spreadsheet Data - Copy and paste the data you want to load from a spreadsheet program.
-
Click Upload.
A data grid appears.
-
-
To add data, click Add Row. See "Editing Data Grid Data".
Copying a Data Grid
To copy a data grid:
-
Run the Websheet application. See "Running a Websheet".
-
From the View menu, select Data Grids.
The Data page appears.
-
Select the data grid you want to edit.
The data grid appears.
-
From the Manage menu, select Copy.
-
Enter a new data grid name and click Copy.
Viewing and Editing a Data Grid
Once you create a data grid, you can view and edit it on the Data page.
Tip:
Data grids display as an interactive report. To learn more about interactive reports and using the Actions menu, see "Using Interactive Reports" and "Using the Actions Menu".Accessing the Data Page
To access the Data page:
-
Run the Websheet application. See "Running a Websheet".
-
From the View menu, select Data Grids.
An interactive report appears displaying all data grids.
-
Click the View Report icon.

Description of the illustration data_page_icons.gif
The Report view appears.

Description of the illustration data_page_rpt.gif
By default, Report view displays the data grid Name, Alias, Status, Created, and Created By columns. The Embed Tag column displays the syntax used to include a link to the report or data grid from within a section of a page.
-
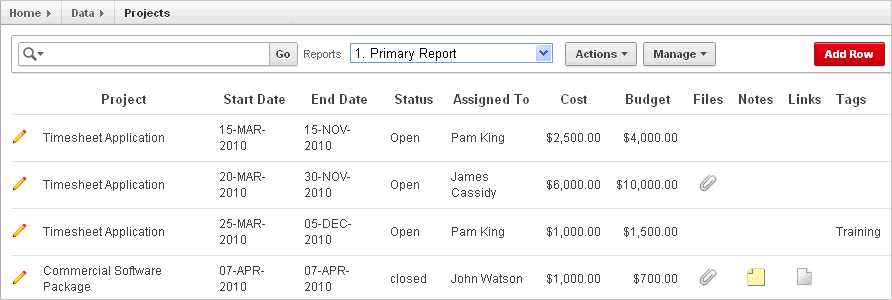
To view a data grid, select the data grid name.
The data grid appears.

Description of the illustration data_grid_view.gif
Note:
If a Data Grid report includes files, notes, or links, those columns are excluded when you download the report using the Actions menu.Toggling Check Boxes
When viewing a data grid, you can enable and disable check boxes. From the Manage menu, select Toggle Check Boxes. By selecting this option, check boxes display to the left of each row.

Description of the illustration data_grid_toggle.gif
Editing Data Grid Data
To edit data grid data:
-
Run the Websheet application. See "Running a Websheet".
-
From the View menu, select Data Grids.
The Data page appears.
-
Select the data grid you want to edit.
The data grid appears.
-
To add another row:
-
Click the Add Row button.
A form appears.
-
Edit the fields provided and click either Save or Save and Add Another.
-
Editing Data Grid Columns Manually
You can manually edit the columns structure of a data grid by selecting Columns and on the Manage menu.
To manually edit data grid columns:
-
Run the Websheet application. See "Running a Websheet".
-
From the View menu, select Data Grids.
The Data page appears.
-
Select the data grid you want to edit.
The data grid appears.
-
From the Manage Menu, select Columns.

Description of the illustration data_grid_col.gif
The following options display:
-
Add - Adds a new column. Enables you to define all column properties such as the column name, type, whether a value is required, list of values, default type, and default text.
-
Column Properties - Editable properties include sequence, group, required value, label, format, heading, width and height, column type, default text, list of values, and help text.
-
List of Values - Enables you to restrict the values a user can enter. You associate a list of values with a column on Column Properties.
-
Column Groups - Create a group and add columns to the group. Add / Edit row page displays groups as a subsection under the Data region and lists columns within the group. By using groups, you can control the Add / Edit row page display.
-
Validation - Create a column validation and error message.
-
Delete Columns - Select columns to be deleted.
-
Editing Data Grid Rows Manually
You can manually edit the rows of a data grid by selecting Rows and on the Manage menu.
To manually edit data grid rows:
-
Run the Websheet application. See "Running a Websheet".
-
From the View menu, select Data Grids.
The Data page appears.
-
Select the data grid you want to edit.
The data grid appears.
-
From the Manage Menu, select Rows.

Description of the illustration data_grid_row.gif
The following options display:
-
Add row - Adds a new row.
-
Set Column Values - Set a predefined value for a column.
-
Replace - Search and replace row values.
-
Fill - Fill NULL column values with a column value from the above cell.
-
Delete Rows - Select rows to be deleted.
-
Editing a Single Data Grid Row
To manually edit a single data grid row:
-
Run the Websheet application. See "Running a Websheet".
-
From the View menu, select Data Grids.
The Data page appears.
-
Select the data grid you want to edit.
The data grid appears.
-
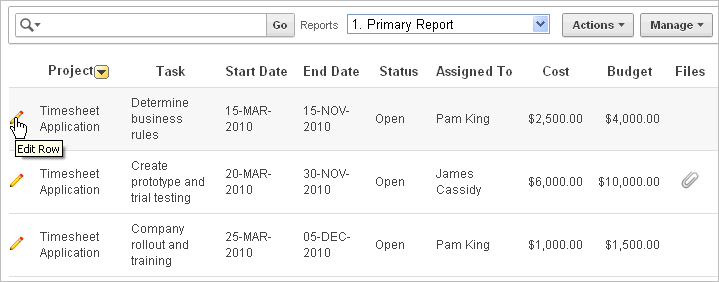
Locate the row to be edited and click the Edit Row icon.

Description of the illustration data_grid_edit_row.gif
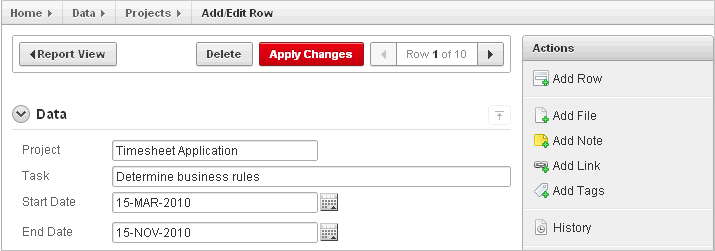
The Add/Edit Row page appears.
-
Edit the appropriate rows and click Apply Changes.
Tip:
You can use the Actions region on the Add/Edit Row page to add a new row, add annotations, view a history of changes, edit column properties and group, delete columns, and create a lists of values or a validation.Adding Annotations to a Single Data Grid Row
To add annotations (that is, files, notes, links, and tags) to a single data grid row:
-
Run the Websheet application. See "Running a Websheet".
-
From the View menu, select Data Grids.
The Data page appears.
-
Select the data grid you want to edit.
The data grid appears.
-
Locate the row to be edited and click the Edit Row icon.
The Add/Edit Row page appears.

Description of the illustration data_grid_annot.gif
-
On the Actions region, select one of the following:
-
Add File
-
Add Note
-
Add Link
-
Add Tags
-
-
Follow the on-screen instructions.
See Also:
"Managing Annotations"Displaying Annotation Columns in a Data Grid Report
To display annotation columns in a data grid report:
-
Add annotations to the data grid report as described in "Adding Annotations to a Single Data Grid Row".
-
To include the columns in the data grid report:
-
View the data grid report.
-
Click the Actions menu and then Select Columns.
-
In the Select Columns region, move the columns (for example, Files, Notes, Links, and Tags) to Display in Report.
-
Click Apply.
-
-
To ensure all users can see the columns, developers can save the revised layout as the default report:
-
Click the Actions menu and select Save Report.
The Save Report Region appears.
-
In Save Report:
-
Save - Select As Default Report Settings.
-
Name - Enter a name for the report.
-
Description - Enter an optional description.
-
Click Apply.
-
-
Editing Data Grid Properties
You can change the name, alias, and description of a data grid on the Data Grid Properties page.
To edit data grid properties:
-
Run the Websheet application. See "Running a Websheet".
-
From the View menu, select Data Grids.
The Data page appears.
-
Select the data grid you want to edit.
The data grid appears.
-
From the Manage menu, click Properties.
The Data Grid Properties page appears.
-
Edit the fields provided and click Apply.
Viewing the Data Grid Change History Log
The View Change History log displays a report of data grid changes. This report lists the row, column name, old value, new value, user who authored the change, and how long ago the change occurred.
To view a history of data grid changes:
-
Run the Websheet application. See "Running a Websheet".
-
From the View menu, select Data Grids.
The Data page appears.
-
Select a data grid
The data grid appears.
-
From the Manage menu, select History.
Deleting a Data Grid
To delete a data grid:
-
Run the Websheet application. See "Running a Websheet".
-
From the View menu, select Data Grids.
The Data page appears.
-
Select the data grid you want to edit.
The data grid appears.
-
From the Manage menu, select Delete Data Grid.
-
Confirm your selection and click Delete.
Tip:
When you delete a Data Grid, chart, or report on a page, referencing the Data Grid will not work.