13 Monitoring BPEL Process Service Components and Engines
This chapter describes how to monitor BPEL process service components and service engines, including monitoring the audit trail and process flow, service component and service engine instances and faults; sensor data; service engine requests and thread statistics; and deployed BPEL process service components.
This chapter includes the following topics:
-
Section 13.1, "Monitoring the Audit Trail and Process Flow of a BPEL Process Service Component"
-
Section 13.2, "Monitoring BPEL Process Service Component Recent Instances and Faults"
-
Section 13.3, "Monitoring BPEL Process Service Component Instances"
-
Section 13.4, "Monitoring Sensor Data and Values in BPEL Process Service Components"
-
Section 13.5, "Monitoring BPEL Process Service Engine Instances and Faults"
-
Section 13.6, "Monitoring BPEL Process Service Engine Request and Thread Statistics"
-
Section 13.7, "Monitoring BPEL Process Service Engine Instances"
-
Section 13.8, "Monitoring Deployed BPEL Process Service Components in the Service Engine"
For more information, see the following sections:
13.1 Monitoring the Audit Trail and Process Flow of a BPEL Process Service Component
This section describes how to view the audit trail and process flow of a BPEL process service component in a SOA composite application instance.
Note:
This section assumes a SOA composite application instance has been initiated. If not, see Section 8.1, "Initiating a SOA Composite Application Test Instance" for instructions.
To view the audit trail and process flow of a BPEL process service component:
-
Access this page through one of the following options:
From the SOA Infrastructure Menu... From the SOA Folder in the Navigator... -
Select Home.
-
Select the Deployed Composites tab.
-
In the Composite section, select a specific SOA composite application.
-
Under soa-infra, expand the partition.
-
Select a specific SOA composite application.
The Dashboard page for the selected composite application appears.
-
-
Use one of the following methods to select an instance of the application:
-
For recent instances of this application, click the instance number of an instance in the Instance ID column of the Recent Instances section.
-
For all instances of this application, click the Instances tab, then click a specific instance in the Instance ID list.
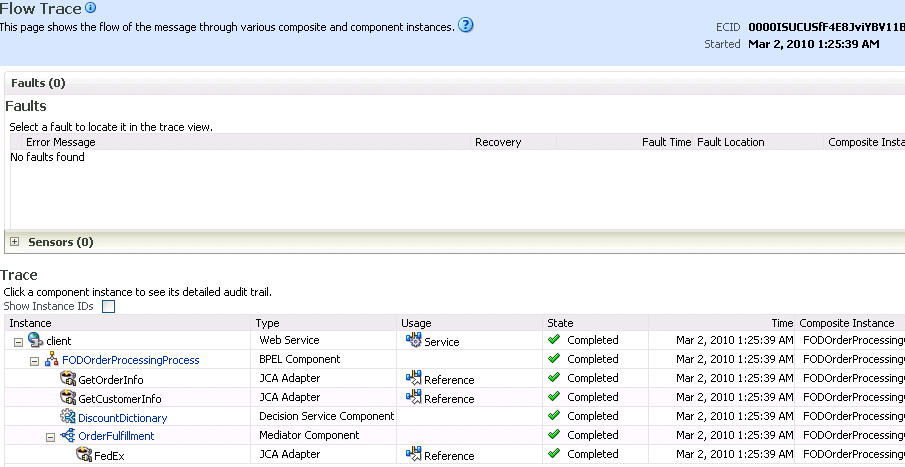
The Flow Trace page displays the following details:
-
The Faults section shows the faults occurring in the services, service components, and references that comprise the SOA composite application. Sensors enable you to monitor BPEL process activities, variables, and faults during runtime. Selecting a fault highlights the row in the Trace section in which the fault occurred. Closing the fault clears the selection in the Trace section.
-
The Sensors section displays details about composite sensors included in the service and reference binding components of the SOA composite application. The total number of sensors is shown in the section header. Composite sensors can be added to service and reference binding components and service components that have subscribed to business events during design time in Oracle JDeveloper. Selecting a composite sensor in this section highlights the service or reference in the Trace section in which composite sensor data was collected. Closing the sensor clears the selection in the Trace section.
Note:
Expand the Faults or Sensors sections one at a time. The fault or sensor information is only displayed for viewing in this way.
-
The Trace section shows the sequence of the message flow through the services, service components, and references that comprise the SOA composite application.
The flow trace is a runtime trail of a message flow identified by an execution context ID (ECID) that is displayed in the upper right-hand corner of the page. An ECID enables you to track a message flow that crosses instances of different composite applications. The flow trace lists all services, references, and components across composite applications participating in the flow.
Description of the illustration bp_compsensor3.gif
For the flow example in the Trace section, the service binding component, service components, and reference binding component involved in the flow have successfully received and processed messages.
-
-
Select a fault in the Faults section.
This highlights the row in the Trace section in which the fault occurred.
-
Close the fault to clear the selection in the Trace section.
-
Expand the Sensors section to display composite sensors.

Description of the illustration bp_compsensor1.gif
-
Select a sensor in the Sensors section.
This highlights the row in the Trace section in which the composite sensor data was collected.
If there are BPEL process messages that require recovery from the Recovery page of the BPEL process service engine, a
BPELMessageRecoveryRequiredinline warning message and recovery icon are displayed.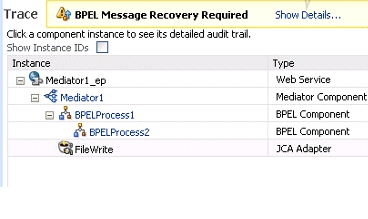
Description of the illustration bpel_recoveryecid2.gif
-
Click Show Details or the recovery icon to display a Warning dialog with the following recovery details:
-
The number of invoke, callback, and activity recoverable message types
-
The ECID value

Description of the illustration bpel_recoveryecid.gif
Use this information for creating search criteria for filtering the recoverable messages on the Recovery page of the BPEL process service engine. You can copy the ECID number from the Warning dialog, paste it into the ECID field, and select the recoverable message type from the Type list. For more information about creating search criteria with the ECID number in the Recovery page, see Section 14.4, "Performing BPEL Process Service Engine Message Recovery."
The display of this message recovery information on the Flow Trace page is controlled by the AuditConfig property in the System MBean Browser. By default, this property is set to All, which enables this information to be displayed. To prevent this information from displaying on the Flow Trace page, set the bpelRecoveryStatus key to Off for the AuditConfig property in the More SOA Infra Advanced Configuration Properties section of the SOA Infrastructure Common Properties page. For more information, see Section 3.1, "Configuring SOA Infrastructure Properties."
Note the following restrictions with ECIDs:
-
A separate ECID is displayed for each instance of a composite application and not for the composite level ECID that can track the complete flow of any instances for the composite application.
-
To get complete flow information, you must find the composite level ECID in the log files. Use that value to get all information for a particular composite and therefore all its executed instances.
-
ECIDs are not propagated through business events. This can limit the amount of logging information that is collected. For example, if you publish an event that is subscribed to in the same composite application, limited logging information is available.
-
-
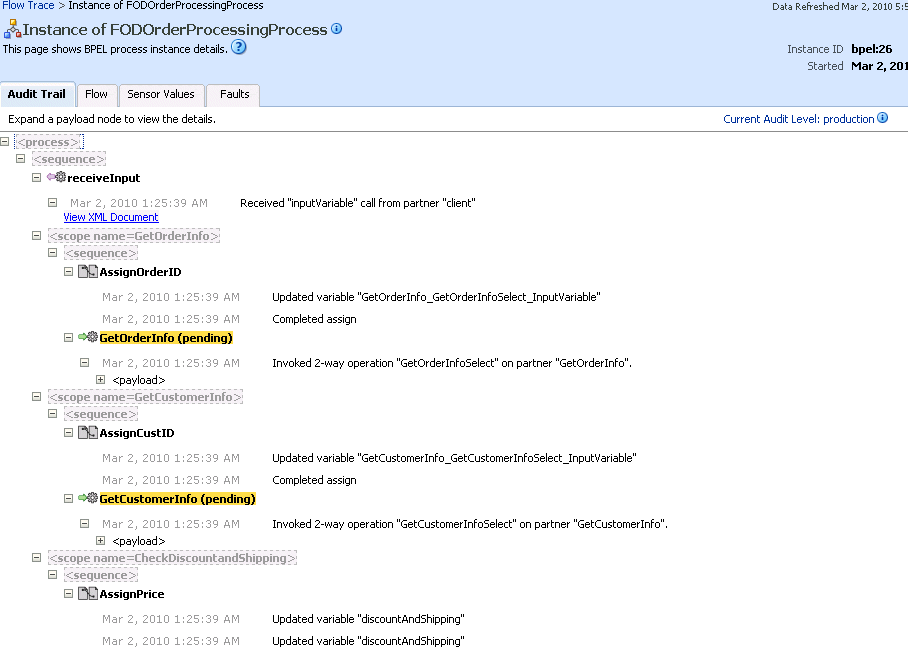
In the Instance column of the Trace section, click a specific BPEL process service component instance. Service component instances can be accessed from this section; services and references cannot be accessed.
The Instance page appears.
Description of the illustration bpel_comp_audittrail.gif
Use these four pages to view the audit trail, flow, sensor values, and faults of a BPEL process service component instance. The following links provide additional details about the instance:
-
Flow Trace link: Click the breadcrumbs in the upper left-hand corner of the page to access the flow trace for the ECID (composite instance) that contains this BPEL component instance.
-
Information icon: Click the information icon to the right of the name of the BPEL component (in the page title) to see biographical information about this BPEL instance. This information includes a summary of the instance, including instance ID, ECID, instance startup time or last modification time, instance state (for example, running), and number of faults.
This icon is only displayed on the Audit Trail pages of BPEL processes and Oracle Mediators, and not on the pages of human tasks and business rules.
-
Audit Level Settings: Click to display information details, such as the audit level used by this instance.
-
View Raw XML: Click to display the raw XML of the audit trail.
The Audit Trail page displays execution details about the activities in the BPEL process.
-
-
Scroll through the audit trail to check for errors and expand the payload links to view their contents at a given point in the flow.
Notes:
-
Canceled onMessage branches of pick or scope activities that did not execute are displayed in the audit trail. However, the flow diagram does not show these same canceled onMessage branches. This is the expected behavior.
-
The following error message appears when a transaction is displayed as rolled back in the Audit Trail page:
The transaction was rolled back. The work performed for bpel
instance "instance_ number" was rolled back to the previous
dehydration point,  but the audit trail has been saved.
You can recover the instance from the recovery console by
resubmitting the callback message or activity for execution
This message does not specifically state whether recovery should happen on either the activity or the callback. This is the intended behavior. Oracle recommends that you do not recover each instance through the audit messages. Instead, set up automatic recovery to recover these instances.
-
-
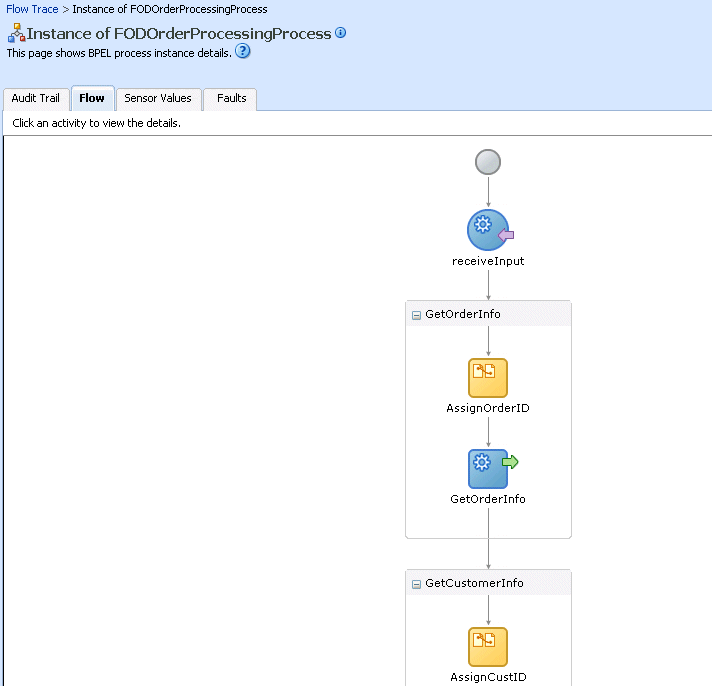
Click the Flow tab.
A flow diagram of the BPEL process activities appears. This flow diagram shows a fault highlighted in a BPEL process activity.
Description of the illustration bpel_comp_flow1.gif
-
Click an activity to view the flow of the payload through the process.
-
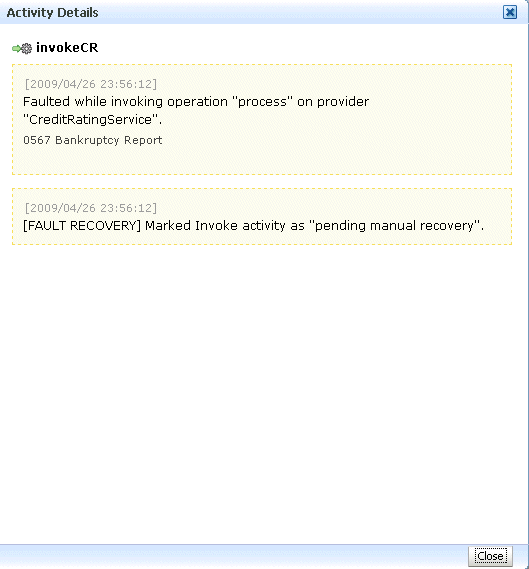
Scroll through the flow diagram to check for errors and click the highlighted activity to view error messages.
Description of the illustration bpel_comp_flow2.gif
-
Close the message.
-
Click the Faults tab.
This page shows the error message, whether you can recover from the fault, the time at which the fault occurred, and the activity in which the fault occurred. This page displays the faults in the BPEL component instance (but not the faults that occurred in a service or reference binding component).
If a fault occurs when processing activities, the activity location of the fault is not usually shown in the Activity column.
-
For Oracle BPEL Process Manager, this column only shows a receive activity that has timed out. In all other cases, this column is empty.
-
For Oracle BPM, this column is always empty.
This is the expected behavior.
You can recover from instance faults identified as recoverable. This page lists all instance faults, recoverable or not. The component instance faults that occurred in a service or reference are not listed here.
This page enables you to target individual faults from which to recover, and provides a degree of fault recovery granularity not available on other pages.

Description of the illustration bpel_instancedetails_faults.gif
However, you cannot perform bulk fault recoveries on this page. To perform bulk fault recovery, use one of the following pages:
-
Faults and Rejected Messages page of a specific SOA composite application or of the SOA Infrastructure
-
Faults page of the BPEL process service engine or of a specific BPEL process service component
-
-
Select a fault for recovery that has been identified as recoverable through one of the following methods. The page refreshes to display a fault recovery section at the bottom of the page.
-
If you click a fault in the Error Message column, a popup message displays details about the fault, including the fault ID, fault time, fault location, fault type, and complete error message text. If the fault is identified as recoverable, a Recover Now button that you can click is displayed.
-
You click a fault identified as recoverable in the Recovery column.
-
-
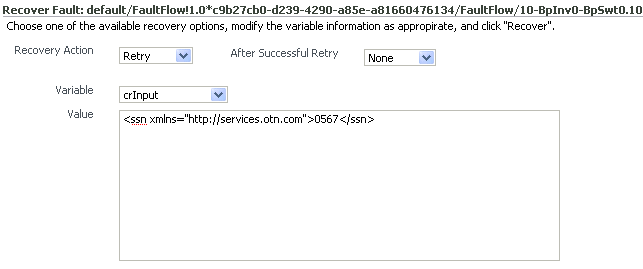
Select an action from the Recovery Action list.
Action Description Retries the instance with an option to provide a retry success action. An example of a scenario in which to use this recovery action is when the fault occurred because the service provider was not reachable due to a network error. The network error is now resolved.
Terminates the entire instance.
Replays the entire scope activity again in which the fault occurred.
Rethrows the current fault. BPEL fault handlers (catch branches) are used to handle the fault. By default, all exceptions are caught by the fault management framework unless an explicit rethrow fault policy is provided.
Ignores the fault and continues processing (marks the faulted activity as a success).
Your selection causes additional fields to appear. For example, the following fields are displayed if you select Rethrow:
Description of the illustration bpel_instancefaultrec2.gif
-
Use the After Successful Retry list to select defined actions to invoke after a successful retry. If you select a variable in the Variable list, you can edit the value in the Value text box.
-
Click the Back button of your browser to exit the flow diagram.
13.1.1 Flow Traces for Composite-to-Composite Invocations on Multiple Servers
When you have multiple SOA composite applications on multiple servers invoking one another, the BPEL process flow trace cannot be rendered to show the correct parent-child relationship. For example, assume you have the following scenario:
-
Composite 1 invokes composite 2, which invokes composite 3.
-
Each composite includes a BPEL process service component.
-
Composite 1 and composite 3 are on server 1, while composite 2 is on server 2.
In this environment, the parent ID of component 3 is set to component 2. However, because composite 2 is on a separate server, the flow trace does not show composite 3 as having a parent. Therefore, composite 3 is placed at the root of the flow trace.
13.1.2 Monitoring BPEL 2.0 Activities in the Audit Trail and Process Flow
You can view the audit trail and process flow for BPEL service component instances that support version 2.0 of the BPEL specification. The following BPEL 2.0 activities can be viewed:
-
Process structural flow-related activities: These activities are similar to other workflow or programming languages for sequencing, iteration, and branching:
-
forEach: This activity is the same as the Oracle extension flowN activity in BPEL 1.1. This activity supports processing multiple sets of activities in both parallel and serial fashion.
-
if: This activity is the same as the switch activity in BPEL 1.1.
-
repeatUntil: This activity provides for repeated execution of a contained activity until the given Boolean condition evaluates to true.
-
-
Exception handling and recovery activities:
-
compensateScope: This activity starts compensation on a specified inner scope that has completed successfully.
-
rethrow: This activity rethrows the fault that was originally caught by the immediately enclosing fault handler.
-
-
Other activities
-
exit: This activity is the same as the terminate activity in BPEL 1.1.
-
dehydrate: This activity enables you to dehydrate an instance. This activity is also available in BPEL 1.1.
-
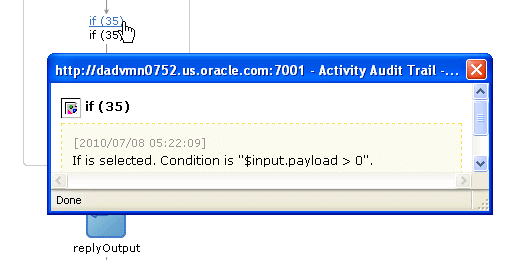
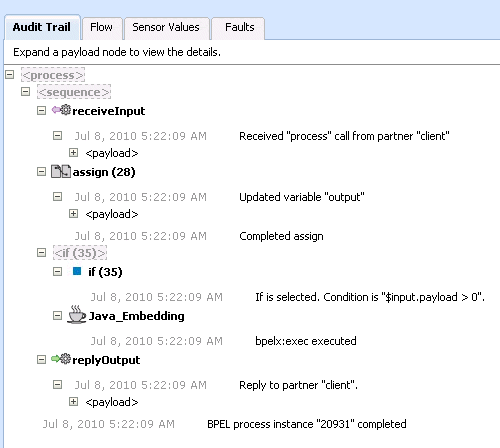
For example, Figure 13-1 shows an if activity in the audit trail of a BPEL process.
Figure 13-1 if Activity in the Audit Trail of a BPEL Process
Description of "Figure 13-1 if Activity in the Audit Trail of a BPEL Process"
Figure 13-2 shows the same if activity in the flow of the BPEL process.
Figure 13-2 if Activity in the Flow of a BPEL Process

Description of "Figure 13-2 if Activity in the Flow of a BPEL Process"
Clicking the if activity displays the condition defined for this activity.
For more information about BPEL 2.0, see the Web Services Business Process Execution Language Version 2.0 specification located at the following URL:
http://www.oasis-open.org
For more information about designing BPEL process service components that support version 2.0 of the BPEL specification, see Oracle Fusion Middleware Developer's Guide for Oracle SOA Suite.
13.2 Monitoring BPEL Process Service Component Recent Instances and Faults
You can monitor recent instances and faults for BPEL process service components. Each service component in a SOA composite application has its own instance ID. These IDs are different from the overall instance ID of the SOA composite application of which each service component is a part.
To monitor BPEL process service component instances and faults:
-
Access this page through one of the following options:
From the SOA Infrastructure Menu... From the SOA Folder in the Navigator... -
Select Home.
-
Select the Deployed Composites tab.
-
In the Composite section, select a specific SOA composite application.
-
Under soa-infra, expand the partition.
-
Select a specific SOA composite application.
-
-
In the Component Metrics section, select the BPEL process service component.
-
Click Dashboard.
The upper part of the Dashboard page displays the following details:
-
Recent instances of the BPEL process service component, including the instance ID, the state of the instance (for example, completed successfully or faulted), the start time, the last modification time, and the logs describing the instance.
-
Recent faults in the BPEL process service component, including the error message, whether you can recover from the fault, the time at which the fault occurred, the instance ID of the BPEL service component, the BPEL activity in which the fault occurred, and the logs describing the fault.
-
The average processing time for each activity in the BPEL process service component.
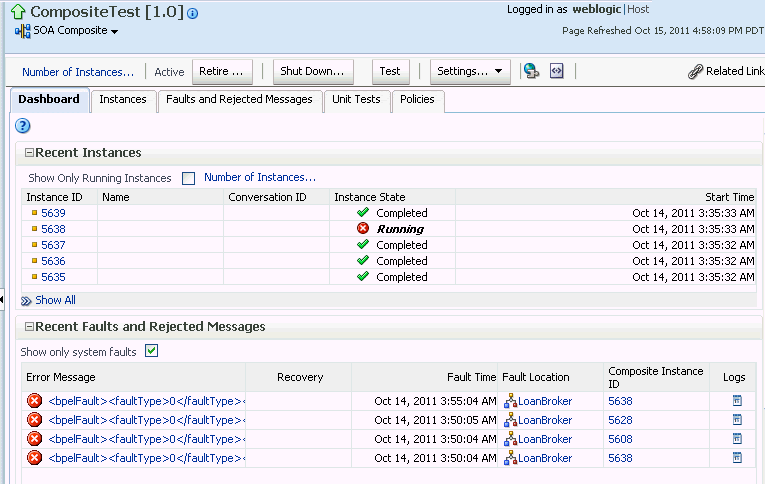
Description of the illustration bpel_comp_dash_upper.gif
-
-
In the Recent Instances section, perform the following tasks:
-
In the Instance ID column, click an instance ID for a service component to view its audit trail, process flow, sensor values, and faults.
-
In the Logs column, click a specific log to access the Log Messages page with filtered messages specific to that instance.
-
Click Show All below the section to access the Instances page of the service component.
-
-
In the Recent Faults section, perform the following tasks:
-
In the Error Message column, click an error message to display complete information about the fault. If the fault is identified as recoverable, click the Recover Now link to perform fault recovery.
-
In the Recovery column, click a fault identified as Recoverable to perform fault recovery at the component instance level.
-
In the Logs column, click a specific log to access the Log Messages page with filtered messages specific to that instance.
-
Click Show All below the section to access the Faults page of the service component.
The lower part of the Dashboard page displays the following details:
-
Details about the time distribution for activities, including the activity name, the total number of activities for all instances, and the average execution time.

Description of the illustration bpel_activity_time_dist.gif
-
A graphical representation of the number of successful, faulted, and incoming (pending) instances of the BPEL process service component over a specific time range. Click Table View to display throughput details for the last five minutes, including the throughput for successful instances, the total faults throughput, and the instance throughput.
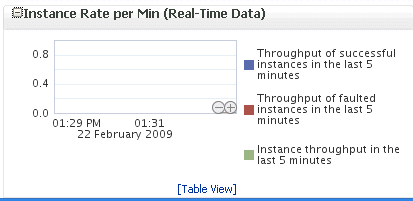
Description of the illustration bpel_comp_dash_lower.gif
-
For more information, see Section 1.2.3, "Introduction to SOA Composite Application Instances" and Oracle Fusion Middleware Administrator's Guide for details about viewing and searching log files.
13.3 Monitoring BPEL Process Service Component Instances
You can monitor BPEL process service component instances. Each service component has its own unique instance ID. This ID is in addition to the instance ID of the overall SOA composite application of which this service component is a part.
To monitor BPEL process service component instances:
-
Access this page through one of the following options:
From the SOA Infrastructure Menu... From the SOA Folder in the Navigator... -
Select Home.
-
Select the Deployed Composites tab.
-
In the Composite section, select a specific SOA composite application.
-
Under soa-infra, expand the partition.
-
Select a specific SOA composite application.
-
-
Select the BPEL process service component in the Component Metrics section.
-
Click Instances.
The Instances page displays the following details:
-
A utility for searching for a specific BPEL service component instance by specifying criteria and clicking Search.
-
BPEL process service component instances, including the instance ID, instance state (for example, completed or faulted), instance start time, last instance modification time, and log files describing the instance.
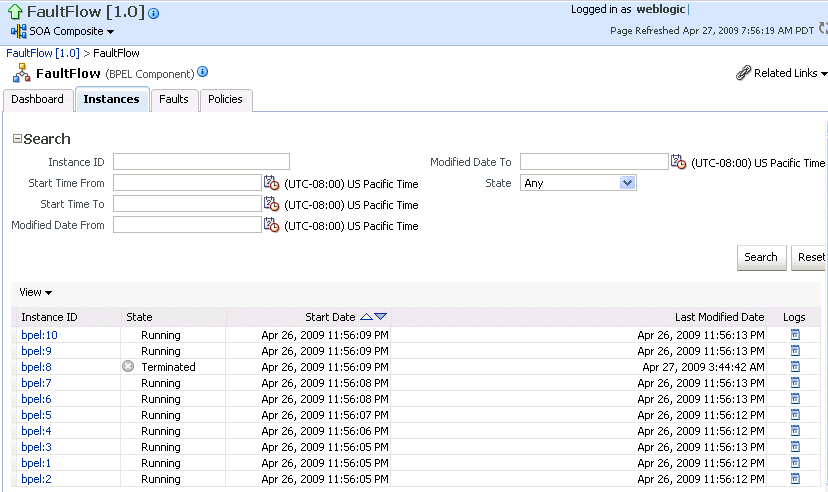
Description of the illustration bpel_com_dash_instances.gif
-
-
In the Instance ID column, click an instance ID for a service component to view its audit trail, process flow, sensor values, and faults.
-
In the Logs column, click a specific log to access the Log Messages page with filtered messages specific to that instance.
For more information, see Section 1.2.3, "Introduction to SOA Composite Application Instances."
13.4 Monitoring Sensor Data and Values in BPEL Process Service Components
You can view the fault, activity, and variable sensor data of a BPEL process service component. You design sensors in BPEL processes and trackable fields in Oracle JDeveloper. Sensors enable you to monitor BPEL process activities, variables, and faults during runtime.
To monitor sensor data and values in BPEL process service components:
-
Access this page through one of the following options:
From the SOA Infrastructure Menu... From the SOA Folder in the Navigator... -
Select Home.
-
Select the Deployed Composites tab.
-
In the Composite section, select a specific SOA composite application.
-
Under soa-infra, expand the partition.
-
Select a specific SOA composite application.
-
-
Use one of the following methods to select an instance of the application:
-
For recent instances of this application, click the instance number of an instance in the Instance ID column of the Recent Instances section.
-
For all instances of this application, click the Instances tab, then click a specific instance in the Instance ID column.
The Flow Trace page appears.
-
-
Click a specific BPEL process service component in the Instance column of the Trace section.
-
Click the Sensor Values tab.
-
Select a sensor to view details.
If you created JMS sensors in your BPEL process, JMS sensor values are not displayed in Oracle Enterprise Manager Fusion Middleware Control. Only sensor values in which the sensor action is to store the values in the database appear (for example, database sensor values).
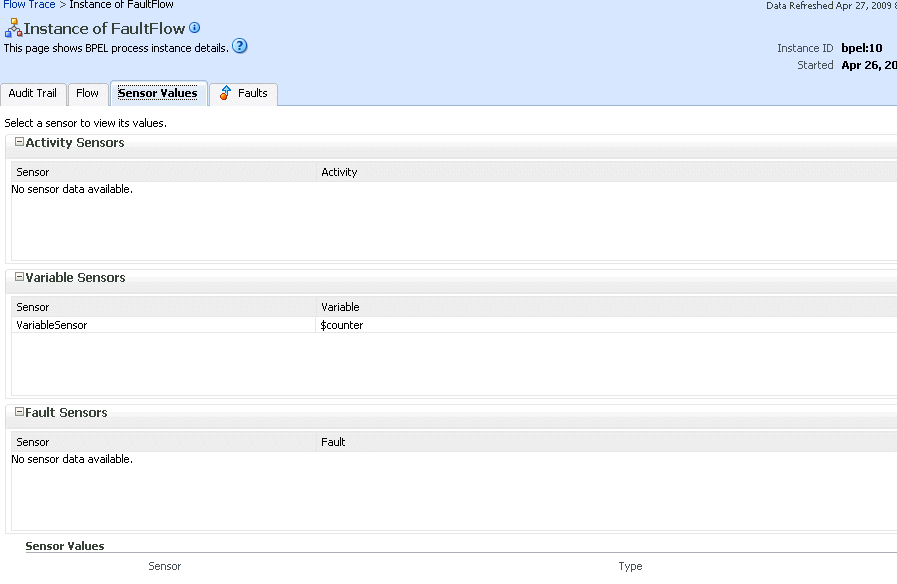
Description of the illustration bpel_comp_sen.gif
For more information about sensors, see Chapter "Using Oracle BPEL Process Manager Sensors" of Oracle Fusion Middleware Developer's Guide for Oracle SOA Suite.
13.4.1 Behavior of Activity Sensors in Compensate and CompensateScope Activities in BPEL 2.0
Assume you have an activity sensor in a BPEL 2.0 compensateScope activity with the evaluation time set to completion and have also configured the activity's variable sensor to point to a variable. You may expect that when the sensor is triggered, the compensation activity completes and the variable shows the state that it is in at the completion of the compensation activities.
However, note that the compensateScope activity (and also a compensate activity) ends immediately after passing control to the compensation activities. As a result, the activity's variable sensor shows the state that it is in at the beginning of the compensation activities, rather than at the end.
This is the expected behavior.
As a workaround for obtaining the variable state upon completion of compensation, add an empty activity after the compensate or compensateScope activity and set the activity sensor on the empty activity with an evaluation time set to activation.
13.5 Monitoring BPEL Process Service Engine Instances and Faults
You can monitor instances and faults of all BPEL process service components running in the BPEL process service engine. These BPEL process service components can be part of separate SOA composite applications.
To monitor BPEL process service engine instances and faults:
-
Access this page through one of the following options:
From the SOA Infrastructure Menu... From the SOA Folder in the Navigator... -
Select Service Engines > BPEL.
-
Right-click soa-infra.
-
Select Service Engines > BPEL.
-
-
Click Dashboard.
The upper part of the Dashboard page displays the following details:
-
A message indicating that the retrieval of recent instances and faults that are displayed on this page is restricted to the specified time period. This message is displayed if the Restrict display of instances and faults to the last time_period checkbox is selected on the SOA Infrastructure Common Properties page (it is selected by default). The default time period value is 24 hours, but you can change this value. If this checkbox is not selected, all instances and faults (including count metrics) for this service engine since the last purging are displayed.
-
Recent instances of all BPEL process service components running in the BPEL process service engine, including the instance ID of the service component, the service component name, the SOA composite application of which the service component is a part, the state of the instance (for example, completed successfully or faulted), the instance start time, the last modification time, and the logs describing the instance.
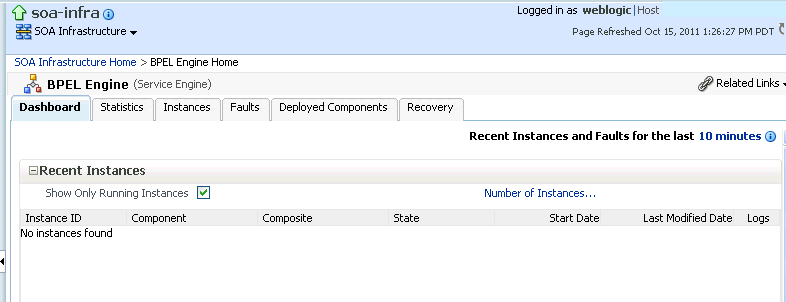
Description of the illustration bpel_dashboard_upper.gif
-
-
In the Recent Instances section, perform the following monitoring tasks:
-
Click the Number of Instances link to display a message showing the numbers of running and total instances for this service engine.
If you selected the Restrict display of instances and faults to the last time_period checkbox on the SOA Infrastructure Common Properties page and specified a time period or accepted the default value, the number of running and total instances for this service engine for that time period are displayed. If you did not select this checkbox, all instances and faults for this service engine since the last purging are displayed. Click Recalculate to recalculate the numbers.
-
In the Instance ID column, click an instance ID for a service component to view its audit trail, process flow, sensor values, and faults.
-
In the Component column, click a specific service component to access its home page.
-
In the Composite column, click a specific SOA composite application to access its home page.
-
In the Logs column, click a specific log to access the Log Messages page with filtered messages specific to that instance.
-
Click Show All below the section to access the Instances page of the service engine.
The lower part of the Dashboard page displays the following details:
-
The service components running in the service engine, the SOA composite applications of the service components, the state of the applications (for example, running), and the total, running, and faulted instances in the service engine.
-
The recent faults in the service engine, including the error message, whether you can recover from the fault, the time at which the fault occurred, the SOA composite application in which the fault occurred, the service component, the instance ID of the service component, the activity in which the fault occurred, and the log files describing the fault.
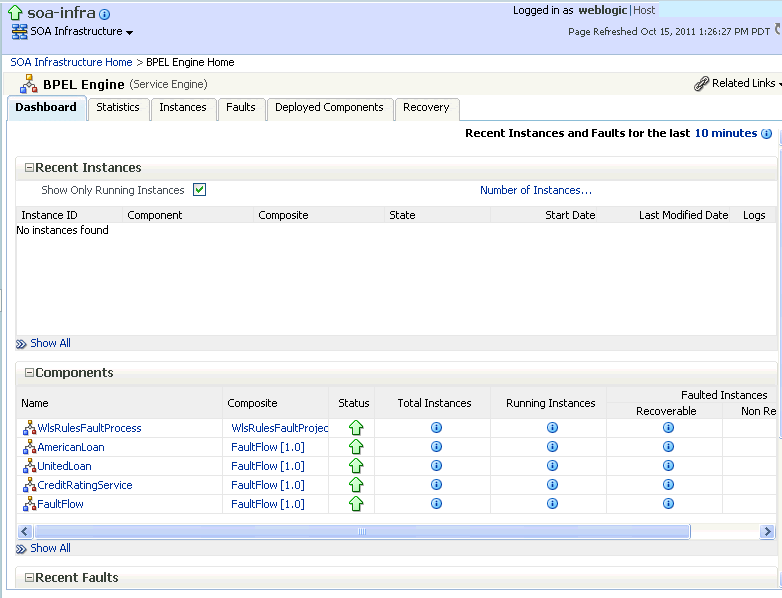
Description of the illustration bpel_dashboard_low.gif
-
-
In the Components section, perform the following tasks:
-
In the Name column, click a specific service component to access its home page.
-
In the Composite column, click a specific SOA composite application to access its home page.
-
Click Show All below the section to access the Deployed Components page of the service engine.
-
-
In the Recent Faults section, perform the following tasks:
-
In the Error Message column, click an error message to display complete information about the fault. If the fault is identified as recoverable, click the Recover Now link to perform fault recovery.
-
In the Recovery column, click a fault identified as Recoverable to perform fault recovery at the component instance level.
-
In the Composite column, click a specific SOA composite application to access its home page.
-
In the Component column, click a specific service component to access its home page.
-
In the Component Instance ID column, click an instance ID for a service component to view its audit trail, process flow, sensor values, and faults.
-
In the Logs column, click a specific log to access the Log Messages page with filtered messages specific to that fault.
-
For more information, see Section 1.2.4, "Introduction to Service Components and Service Component Instances."
13.6 Monitoring BPEL Process Service Engine Request and Thread Statistics
You can monitor request and thread statistics for all BPEL process service components running in the service engine.
To monitor BPEL process service engine request and thread statistics:
-
Access this page through one of the following options:
From the SOA Infrastructure Menu... From the SOA Folder in the Navigator... -
Select Service Engines > BPEL.
-
Right-click soa-infra.
-
Select Service Engines > BPEL.
-
-
Click Statistics.
The upper part of the Statistics page displays the following details. Click the Help icon for additional details.
-
Pending requests in the service engine
-
Active requests in the service engine
-
Thread statistics for the service engine
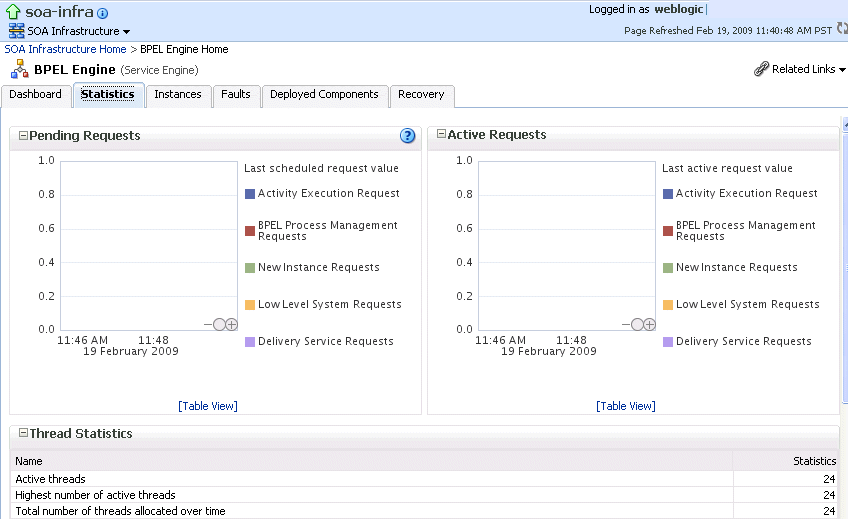
Description of the illustration bpel_stats_upper.gif
The lower part of the Statistics page displays details about the count and minimum, maximum, and average request processing times.

Description of the illustration bpel_stats_lower.gif
-
13.7 Monitoring BPEL Process Service Engine Instances
You can monitor all BPEL process service component instances running in the service engine. These BPEL process service components can be part of separate SOA composite applications.
To monitor BPEL process service engine instances:
-
Access this page through one of the following options:
From the SOA Infrastructure Menu... From the SOA Folder in the Navigator... -
Select Service Engines > BPEL.
-
Right-click soa-infra.
-
Select Service Engines > BPEL.
-
-
Click Instances.
The Instances page displays the following details:
-
A utility for searching for a specific instance by specifying criteria and clicking Search.
-
Instances, including the instance ID of the service component, the service component name, the SOA composite application name, the state of the instance (for example, completed successfully, running, or faulted), the instance start time, the last modification time, and the log files describing the instance.
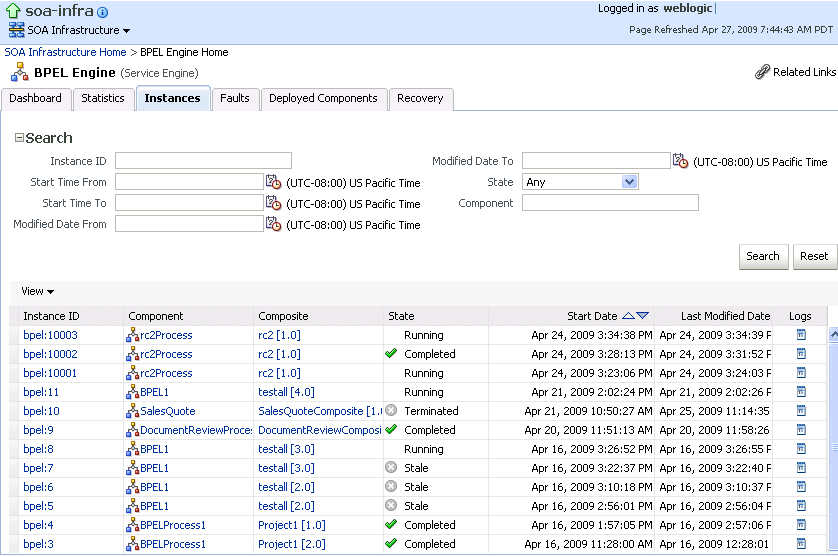
Description of the illustration bpel_instances.gif
-
-
In the Instances section, perform the following monitoring tasks:
-
In the Instance ID column, click an instance ID for a service component to view its audit trail, process flow, sensor values, and faults.
-
In the Component column, click a specific service component to access its home page.
-
In the Composite column, click a specific SOA composite application to access its home page.
-
In the Logs column, click a specific log to access the Log Messages page with filtered messages specific to that instance.
-
For more information, see Section 1.2.4, "Introduction to Service Components and Service Component Instances."
13.8 Monitoring Deployed BPEL Process Service Components in the Service Engine
You can monitor all deployed SOA composite applications with BPEL process service components running in the service engine.
To monitor deployed BPEL processes in service engines:
-
Access this page through one of the following options:
From the SOA Infrastructure Menu... From the SOA Folder in the Navigator... -
Select Service Engines > BPEL.
-
Right-click soa-infra.
-
Select Service Engines > BPEL.
-
-
Click Deployed Components.
The Deployed Components page displays the following details:
-
A utility for searching for a specific deployed SOA composite application by specifying criteria and clicking Search.
-
Details about deployed SOA composite applications with BPEL process service components running in this service engine, including the service component name, the SOA composite application, the current status, and the total, running, and faulted instances in the service engine.
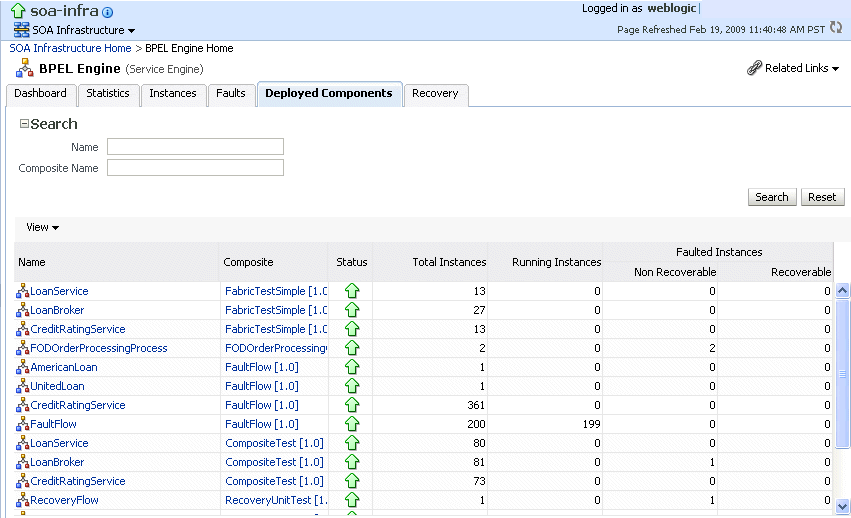
Description of the illustration bpel_se_deployedcomps.gif
-
-
In the Name column, click a specific service component to access its home page.
-
In the Composite column, click a specific SOA composite application to access its home page.
