8.4 Use the Report Wizard to Layout the Data
Once your data model is complete, you need to create a layout for the data objects to display in the report output. The Report Wizard enables you to create layouts for your data model.
Tip:
When you have multiple queries in your data model, make sure that you check the names of the groups associated with each query prior to entering the Report Wizard. The Report Wizard requires you to choose data for the layout by group name.-
In the Data Model view, right-click on the canvas, then choose Report Wizard.
-
In the Report Wizard, on the Report Type page, select Create Paper Layout only.
-
On the Style page, select Tabular.
-
On the Groups page, ensure that both groups from your data model appear in the Displayed Groups list.
-
On the Fields page, click the double right arrows (>>) to move all of the fields to the Displayed Fields list.
-
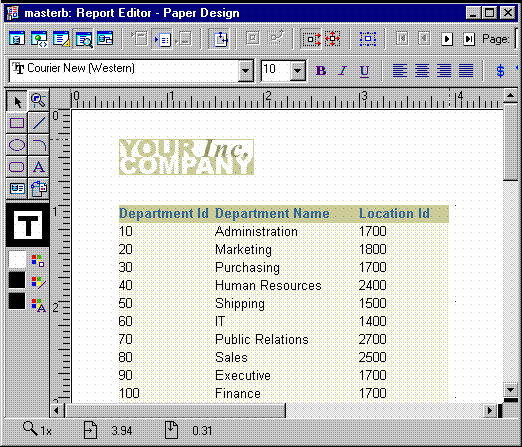
On the Template page, select Predefined Template and click Beige, then click Finish to display your report output in the Paper Design view. The output for the Department report should look something like this:
Figure 8-4 Paper Design view for the Master/Master report

Description of "Figure 8-4 Paper Design view for the Master/Master report "