1.3 Report Styles
The topics in this section describe the built-in report styles in Oracle Reports Builder.
1.3.1 About tabular reports
A tabular report is the most basic type of report. Each column corresponds to a column selected from the database.
1.3.2 About group above reports
A group above report contains multiple groups in its data model. It is a "master/detail" report, where there may be a lot of information in the master group. For every master group, the related values of the detail group(s) are fetched from the database and are displayed below the master information.
1.3.3 About group left reports
A group left report also contains multiple groups in its data model, dividing the rows of a table based on a common value in one of the columns. Use this type of report to restrict a column from repeating the same value several times while values of related columns change. The data model for group above and group left reports is the same, but the layouts differ; group above reports display the master information at the top while group left reports display break columns to the side.
1.3.4 About form-like reports
A form-like report displays one record per page, displaying field values to the right of field labels.
1.3.5 About form letter reports
A form letter report contains database values embedded in boilerplate text (any text that you enter or import into a Report Editor.)
1.3.6 About mailing label reports
A mailing label report prints mailing labels in multiple columns on each page. Using the Report Wizard, you can specify the format for your mailing labels.
1.3.7 About matrix reports
A matrix (cross-product) report is a cross-tabulation of four groups of data:
-
One group of data is displayed across the page.
-
One group of data is displayed down the page.
-
One group of data is the cross-product, which determines all possible locations where the across and down data relate and places a cell in those locations.
-
One group of data is displayed as the "filler" of the cells.
Thus, to create a matrix report, you need at least four groups in the data model: one group must be a cross-product group, two of the groups must be within the cross-product group to furnish the "labels", and at least one group must provide the information to fill the cells. The groups can belong to a single query or to multiple queries.
A distinguishing feature of matrix reports is that the number of columns is not known until the data is fetched from the database.
With Oracle Reports Builder, you can create many different matrix reports. The four general types of matrix reports are simple matrix, nested matrix, multiquery matrix with break, and matrix break, but you are not confined to these designs.
For a detailed example, see Chapter 25, "Building a Matrix Report".
1.3.7.1 Matrix data model
In building your matrix data model, you should consider the following:
-
number of queries
-
group structure
-
summary settings
1.3.7.1.1 Number of queries
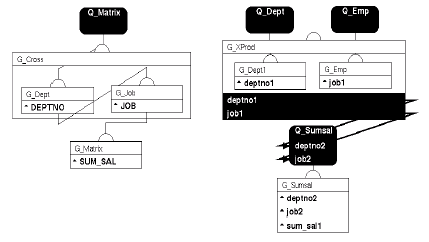
Although matrix reports always require at least four groups, they can be built with any number of queries. If you build a matrix report with only one query (usually the most efficient structure), you must create at least three groups in addition to the one created by default. If you build a matrix report with multiple (three or more) queries, you still need to create at least one additional group. The figure below illustrates the two types of query structures that you can use for your matrix data model.
One advantage to a one-query data model is that the resulting report is generally more efficient than a report based on a multiquery data model.
Multiquery matrix. You may consider using a multiquery data model, as it often has simple queries and can be easier to maintain than the equivalent one-query data model. In addition, a multiquery data model is required for some types of matrices (for example, some nested matrix reports).
1.3.7.1.2 Group structure
Matrix reports are built with four or more groups:
-
Two or more dimension groups. Dimension groups are contained within the cross product group. In the layout, the information in at least one group goes across the page, and the information in at least one group goes down the page, forming a grid. The information in these groups is sometimes referred to as "matrix labels", as they appear to provide column and row labels for the matrix.
-
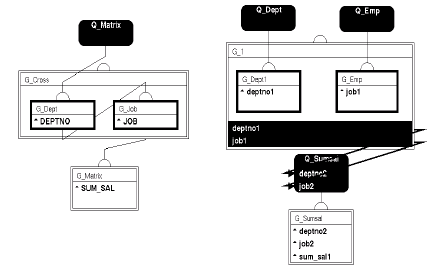
One or more cross product groups. The cross product group represents all possible combinations of the values of the dimension groups. In the layout, the cross product group is represented by the intersection of the repeating frames for the across and down dimension groups. When the report is run, it expands, and each instance of data intersection becomes a separate cell. This concept is sometimes best understood graphically, as in the figure below. The rectangles are cells, and show where each department/job combination is valid.
-
One cell, or "filler" group. The cell group contains the actual information that is represented by the cells of the cross product. For each intersection of the values of the dimension groups (cell), the cell group contains zero, one, or multiple values. When the report is run, these values appear in the appropriate cells.
The following figure shows graphical representations of how groups are related for both single and multiquery data models.
Figure 1-4 Matrix data model relationships

Description of "Figure 1-4 Matrix data model relationships"
Notice that for each data model the cross product group is represented by the large rectangle, while the dimension groups are the smaller rectangles enclosed by it, and the cell group is shown outside of the cross product group.
1.3.7.1.3 Summary settings
Creating a summary for a matrix requires more information than creating a summary for other kinds of reports. When you create summary columns for your matrix, you need to indicate the following:
-
The frequency of the summary. The frequency specifies the dimension groups for which to compute the summary.
-
The order in which to compute the summary. The order specifies how to traverse the matrix in calculating the summary (top to bottom or left to right).
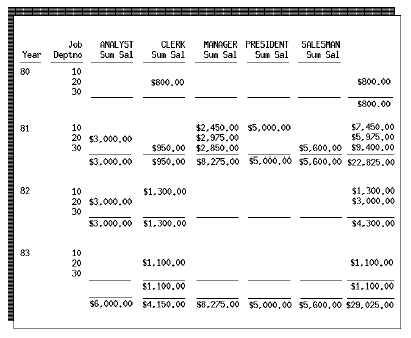
In Oracle Reports Builder, you specify this information by setting the Product Order property for your summary. All summaries that are owned by the cross product group require that a Product Order be specified. Suppose that you have a matrix report that looks something like the one below.
This is a nested matrix report. Assume that group G_YEAR contains the YEAR column, G_DEPT contains the DEPTNO column, G_JOB contains the JOB column, and G_CROSS is the cross product group.
To create the summary of salaries by job that appears at the bottom of the matrix for each job, you create a summary column in G_CROSS with the following property settings:
These settings specify that the summary should be calculated for each job in the G_JOB group and the summary should be reset to zero for each job in the G_JOB group.
To create the summary of salaries by year which appears at the right of the matrix directly underneath the boilerplate lines, you create a summary column in G_CROSS with the following property settings:
These settings specify that the summary should be calculated for each year in the G_YEAR group and the summary should be reset to zero for each year in the G_YEAR group. To create the summary of salaries by year and department that appears at the right of the matrix for each department row of the matrix that contains a value, you create a summary column in G_CROSS with the following property settings:
These settings specify that the summary should be calculated for each record of G_DEPT within each record of G_YEAR. G_DEPT comes after G_YEAR in the Product Order because, in this report, it changes more frequently than G_YEAR. If G_YEAR changed more frequently (that is, years were listed for each department), it would make more sense to have a Product Order of G_DEPT, G_YEAR.
This summary is reset to zero for each record in the G_DEPT group. When you have multiple groups listed in Product Order and you want a non-running summary, the reset group should be the same as the last group in Product Order. When you have multiple groups listed in the Product Order and you want a running summary, the reset group should be a group other than the last one in the Product Order.
1.3.7.2 Matrix layout
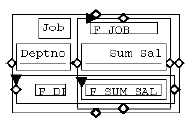
The figure below shows the objects that make up a simple, two-dimensional matrix. All of these objects are necessary for a matrix, except for the boilerplate field labels.
A matrix layout model must consist of the following layout objects:
-
At least three repeating frames: one with the Print Direction property set to Down, one with the Print Direction property set to Across, and one for the cell in the matrix object.
-
Several group, header, and footer (if summaries are included) frame.
-
A matrix object created for the cross product group, inside of which are the cells of the matrix (for example, the rectangle in the figure above with F_SUMSAL inside it).
-
Boilerplate for each column and row of values, as well as for summaries (for example, Job and Deptno). Displaying the boilerplate is optional, but Oracle Reports Builder will generate it by default.
Note:
When running a JSP-based Web report that includes a matrix object, the JSP<rw:include> tag expects the matrix object to format on only one page. However, if the cells in the across repeating frame expand, the column headers of the matrix may be forced onto a second page regardless of the page size. Therefore, these matrix headers will not appear in the report output. Additionally, in this situation, the paper layout does not display correctly as header fields move to subsequent pages where the cell values remain on the first page. To resolve this, it is important to carefully define in the Report Editor the space available to the across repeating frame to allow for displaying the largest values, then set the Vertical Elasticity property of the across repeating frame to Fixed.1.3.7.2.1 Matrix object
The matrix object defines the intersection of at least two repeating frames. The repeating frames are the dimensions of the matrix and the matrix object contains the repeating frame that will hold the "filler" or values of the cell group. You need one matrix object for each pair of intersecting repeating frames in the layout. One of the repeating frames must have the Print Direction property set to Down and the other must have the Print Direction property set to Across in order to form a matrix.
For more details, see Section 2.3.7, "About matrix objects".
You can improve the performance of matrix reports with:
-
fewer queries
-
WHERE clauses
Note:
Cross-product groups always cause "fetching ahead." The reason for this is that to cross-tabulate the data in a cross-product group, Oracle Reports Builder must first fetch all of the data.
Section 2.3.7, "About matrix objects"
Section 2.1.7, "About nested matrix reports"
Section 2.1.8, "About matrix with group reports"


