| Skip Navigation Links | |
| Exit Print View | |

|
Oracle Solaris Studio 12.3: Thread Analyzer User's Guide Oracle Solaris Studio 12.3 Information Library |
| Skip Navigation Links | |
| Exit Print View | |

|
Oracle Solaris Studio 12.3: Thread Analyzer User's Guide Oracle Solaris Studio 12.3 Information Library |
1. What is the Thread Analyzer and What Does It Do?
2.1 Data Race Tutorial Source Files
2.1.1 Getting the Data Race Tutorial Source Files
2.1.2 Source Code for prime_omp.c
2.1.3 Source Code for prime_pthr.c
2.1.3.1 Effect of Data Races in prime_omp.c and prime_pthr.c
2.2 How to Use the Thread Analyzer to Find Data Races
2.2.1.1 To Instrument Source Code
2.2.1.2 To Instrument Binary Code
2.2.2 Create a Data Race Detection Experiment
2.2.3 Examine the Data Race Detection Experiment
2.2.3.1 Using Thread Analyzer to View the Data Race Experiment
2.2.3.2 Using er_print to View the Data Race Experiment
2.3 Understanding the Experiment Results
2.3.1 Data Races in prime_omp.c
2.4 Diagnosing the Cause of a Data Race
2.4.1 Check Whether or Not the Data Race is a False Positive
2.4.2 Check Whether or Not the Data Race is Benign
2.4.3 Fix the Bug, Not the Data Race
2.4.3.1 Fixing Bugs in prime_omp.c
2.4.3.2 Fixing Bugs in prime_pthr.c
2.5.1 User-Defined Synchronizations
2.5.2 Memory That is Recycled by Different Threads
2.6.1 A Program for Finding Primes
2.6.2 A Program that Verifies Array-Value Types
2.6.3 A Program Using Double-Checked Locking
This section shows how to use both the er_print command line and the Thread Analyzer GUI to display the following information about each detected data race:
The unique ID of the data race.
The virtual address, Vaddr, associated with the data race. If there is more than one virtual address, then the label Multiple Addresses is displayed in parentheses.
The memory accesses to the virtual address, Vaddr by two different threads. The type of the access (read or write) is shown, as well as the function, offset, and line number in the source code where the access occurred.
The total number of call stack traces associated with the data race. Each trace refers to the pair of thread call stacks at the time the two data race accesses occurred. If you are using the GUI, the two call stacks are displayed in the Race Details tab when an individual call stack trace is selected. If you are using the er_print utility, the two call stacks will be displayed by the rdetail command.
To examine data races in prime_omp.c, you can use one of the experiments you created in 2.2.2 Create a Data Race Detection Experiment.
To show the data race information in the prime_omp_instr.er experiment with er_print, type the following command.
% er_print prime_omp_inst.er
At the (er_print) prompt, type races to see output similar to the following:
(er_print)races

Total Races:  2 Experiment:  prime_omp_inst.er

Race #1, Vaddr: 0x21ca8
      Access 1: Write, is_prime,
                       line 26 in "prime_omp.c"
      Access 2: Read,  is_prime,
                       line 23 in "prime_omp.c"
  Total Callstack Traces: 1

Race #2, Vaddr: (Multiple Addresses)
      Access 1: Write, main,
                       line 50 in "prime_omp.c"
      Access 2: Write, main,
                       line 50 in "prime_omp.c"
  Total Callstack Traces: 2
(er_print)
Two data races occurred during this particular run of the program.
To open the prime_omp_inst.er experiment in the Thread Analyzer, type the following command:
% tha prime_omp_inst.er
The following screen shot shows the races that were detected in prime_omp.c as displayed by the Thread Analyzer.
Figure 2-1 Data Races Detected in prime_omp.c
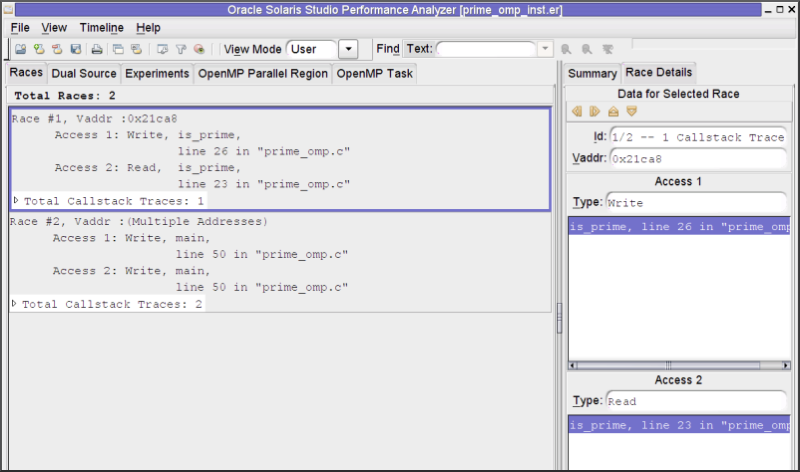
Two data races are shown in prime_omp.c:
Race #1 shows a race between a write in the function is_prime on line 26 and a read in the same function on line 23. If you look at the source code you can see that on these lines, the pflag[ ] array is being accessed. In the Thread Analyzer, you can click the Dual Source tab to easily see the source code at both line numbers along with metrics showing the number of race accesses on the affected lines of code.
Race #2 shows a race between two writes to line 50 of the main function. Click the Dual Source tab to see that there are multiple attempts to access the value of the primes [ ] array in line 50.
Race #2 represents a group of data races that occur in different elements of the array primes[ ]. This is indicated by the Vaddr specified as Multiple Addresses.
The Dual Source tab in the Thread Analyzer allows you to see the two source locations associated with a data race at the same time. For example, select Race #2 for prime_pthr.c in the Races tab and then click on the Dual Source tab. You will see something similar to the following.
Figure 2-2 Source Code of Data Races Detected in prime_omp.c
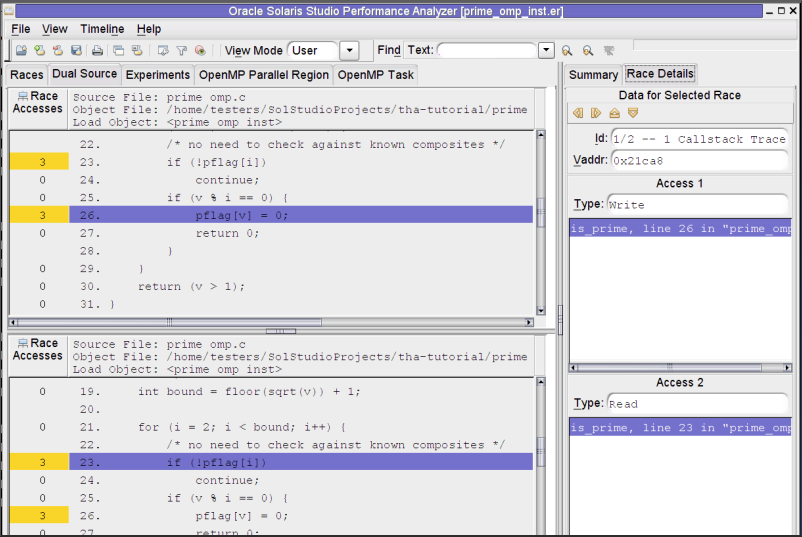
Tip - You might need to drag the mouse on the header of each source panel to see the Race Accesses metrics in the left margin of the Dual Source tab.
To examine data races in prime_pthr.c, you can use one of the experiments you created in 2.2.2 Create a Data Race Detection Experiment.
To show the data race information in the prime_pthr_instr.er experiment with er_print, type the following command:
% er_print prime_pthr_inst.er
At the (er_print) prompt, type races to see output similar to the following:
(er_print) races

Total Races:  4 Experiment:  prime_pthr_inst.er

Race #1, Vaddr: (Multiple Addresses)
      Access 1: Write, is_prime + 0x00000270,
                       line 27 in "prime_pthr.c"
      Access 2: Write, is_prime + 0x00000270,
                       line 27 in "prime_pthr.c"
  Total Callstack Traces: 2

Race #2, Vaddr: 0xffbfe714
      Access 1: Write, main + 0x0000025C,
                       line 60 in "prime_pthr.c"
      Access 2: Read,  work + 0x00000070,
                       line 40 in "prime_pthr.c"
  Total Callstack Traces: 1

Race #3, Vaddr: (Multiple Addresses)
      Access 1: Write, work + 0x00000150,
                       line 44 in "prime_pthr.c"
      Access 2: Write, work + 0x00000150,
                       line 44 in "prime_pthr.c"
  Total Callstack Traces: 2

Race #4, Vaddr: 0x21a90
      Access 1: Write, work + 0x00000198,
                       line 45 in "prime_pthr.c"
      Access 2: Write, work + 0x00000198,
                       line 45 in "prime_pthr.c"
  Total Callstack Traces: 2
(er_print)
Four data races occurred during this particular run of the program.
To open the prime_pthr_inst.er experiment in the Thread Analyzer, type the following command:
% tha prime_pthr_inst.er
The following screen shot shows the races detected in prime_pthr.c as displayed by the Thread Analyzer. Notice that they are the same as the races shown by er_print.
Figure 2-3 Data Races Detected in prime_pthr.c
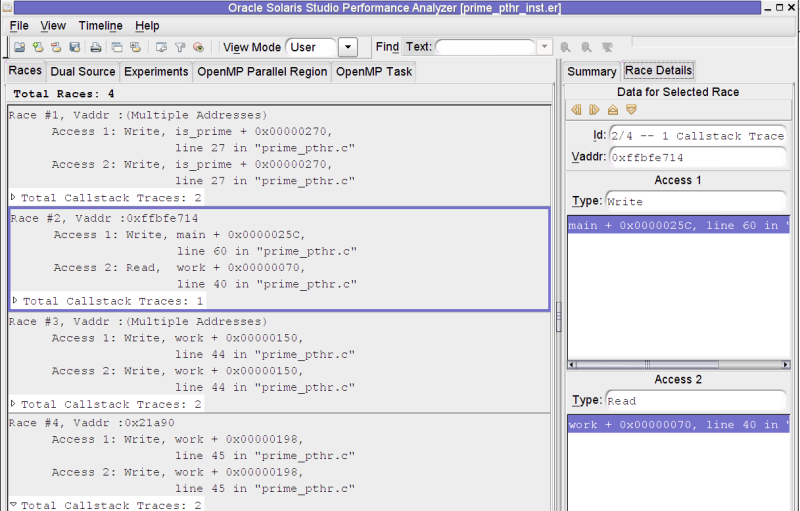
Four data races are shown in prime_pthr.c:
Race #1 is a data race between a write to the pflag[ ] array in function is_prime on line 27 and another write to pflag[ ] on the same line.
Race #2 is a data race between a write on line 60 to the memory location named i in main() and a read on line 40 from the same memory location (named *arg in work()).
Race #3 is a data race between a write to primes[total] on line 44 and another write to primes[total] the same line.
Race #4 is a data race between a write to total on line 45 and another write to total on the same line.
If you select Race #2 and then click the Dual Source tab, you see the two source locations, similar to the following screen shot.
Figure 2-4 Source Code Details of a Data Race
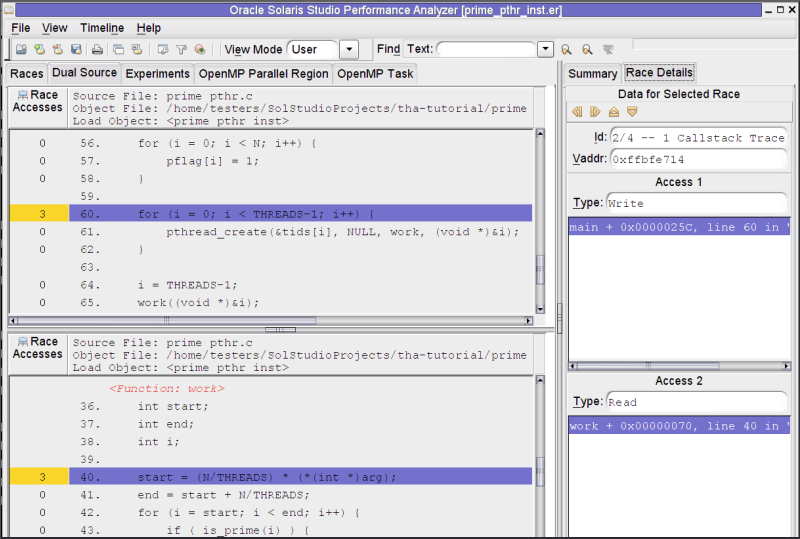
The first access for Race #2 is at line 60 and is shown in the top panel. The second access is at line 40 and is shown in the bottom panel. The Race Accesses metric is highlighted at the left of the source code. This metric gives a count of the number of times a data race access was reported on that line.
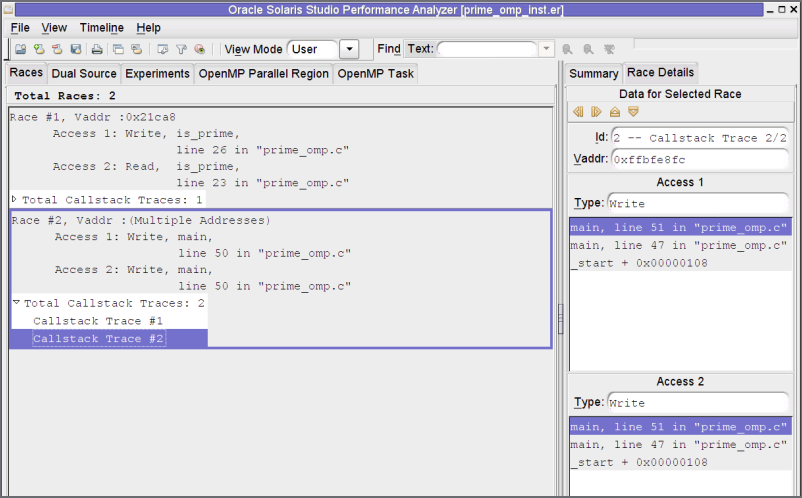
Each data race listed in the Races tab of the Thread Analyzer also has one or more associated Call Stack Traces. The call stacks show the execution paths through the code that lead to a data race. When you click a Call Stack Trace, the Race Details tab in the right panel shows the function calls that lead to the data race.
Figure 2-5 Races Tab with Call Stack Traces for prime_omp.c
