| Skip Navigation Links | |
| Exit Print View | |

|
Oracle Solaris Studio 12.3: Thread Analyzer User's Guide Oracle Solaris Studio 12.3 Information Library |
| Skip Navigation Links | |
| Exit Print View | |

|
Oracle Solaris Studio 12.3: Thread Analyzer User's Guide Oracle Solaris Studio 12.3 Information Library |
1. What is the Thread Analyzer and What Does It Do?
3.2 Getting the Deadlock Tutorial Source Files
3.2.1 Source Code Listing for din_philo.c
3.3 The Dining Philosophers Scenario
3.3.1 How the Philosophers Can Deadlock
3.3.2 Introducing a Sleep Time for Philosopher 1
3.4 How to Use the Thread Analyzer to Find Deadlocks
3.4.2 Create a Deadlock Detection Experiment
3.4.3 Examine the Deadlock Detection Experiment
3.4.3.1 Using Thread Analyzer to View the Deadlock Detection Experiment
3.4.3.2 Using er_print to View the Deadlock Detection Experiment
3.5 Understanding the Deadlock Experiment Results
3.5.1 Examining Runs That Deadlock
3.5.2 Examining Runs That Complete Despite Deadlock Potential
3.6 Fixing the Deadlocks and Understanding False Positives
3.6.1 Regulating the Philosophers With Tokens
3.6.1.1 A False Positive Report
3.6.2 An Alternative System of Tokens
This section explains how to use the Thread Analyzer to investigate the deadlocks in the dining philosopher program.
The following listing shows a run of the dining philosophers program that results in an actual deadlock.
% cc -g -o din_philo din_philo.c
% collect -r deadlock -o din_philo.1.er din_philo
Creating experiment database din_philo.1.er ...
Philosopher 1 is done thinking and now ready to eat.
Philosopher 2 is done thinking and now ready to eat.
Philosopher 3 is done thinking and now ready to eat.
Philosopher 0 is done thinking and now ready to eat.
Philosopher 1: got right  chopstick 1
Philosopher 3: got right  chopstick 3
Philosopher 0: got right  chopstick 0
Philosopher 1: got left chopstick 2
Philosopher 3: got left chopstick 4
Philosopher 4 is done thinking and now ready to eat.
Philosopher 1: eating.
Philosopher 3: eating.
Philosopher 3: got right  chopstick 3
Philosopher 4: got right  chopstick 4
Philosopher 2: got right  chopstick 2
Philosopher 0: got left chopstick 1
Philosopher 0: eating.
Philosopher 1: got right  chopstick 1
Philosopher 4: got left chopstick 0
Philosopher 4: eating.
Philosopher 0: got right  chopstick 0
Philosopher 3: got left chopstick 4
Philosopher 3: eating.
Philosopher 4: got right  chopstick 4
Philosopher 2: got left chopstick 3
Philosopher 2: eating.
Philosopher 3: got right  chopstick 3
Philosopher 1: got left chopstick 2
Philosopher 1: eating.
Philosopher 2: got right  chopstick 2
Philosopher 0: got left chopstick 1
Philosopher 0: eating.
Philosopher 1: got right  chopstick 1
Philosopher 4: got left chopstick 0
Philosopher 4: eating.
Philosopher 0: got right  chopstick 0
Philosopher 3: got left chopstick 4
Philosopher 3: eating.
...
Philosopher 4: got right  chopstick 4
Philosopher 2: got left chopstick 3
Philosopher 2: eating.
Philosopher 2: got right  chopstick 2
Philosopher 3: got right  chopstick 3
(hang)

Execution terminated by pressing CTRL-C
Type the following commands to examine the experiment with er_print utility:
% er_print din_philo.1.er
(er_print) deadlocks
Deadlock #1, Potential deadlock
  Thread #2
    Lock being held:        0x215a0, at: grab_chopstick + 0x0000002C, line 106 in "din_philo.c"
    Lock being requested:   0x215b8, at: grab_chopstick + 0x0000002C, line 106 in "din_philo.c"
  Thread #3
    Lock being held:        0x215b8, at: grab_chopstick + 0x0000002C, line 106 in "din_philo.c"
    Lock being requested:   0x215d0, at: grab_chopstick + 0x0000002C, line 106 in "din_philo.c"
  Thread #4
    Lock being held:        0x215d0, at: grab_chopstick + 0x0000002C, line 106 in "din_philo.c"
    Lock being requested:   0x215e8, at: grab_chopstick + 0x0000002C, line 106 in "din_philo.c"
  Thread #5
    Lock being held:        0x215e8, at: grab_chopstick + 0x0000002C, line 106 in "din_philo.c"
    Lock being requested:   0x21600, at: grab_chopstick + 0x0000002C, line 106 in "din_philo.c"
  Thread #6
    Lock being held:        0x21600, at: grab_chopstick + 0x0000002C, line 106 in "din_philo.c"
    Lock being requested:   0x215a0, at: grab_chopstick + 0x0000002C, line 106 in "din_philo.c"

Deadlock #2, Actual deadlock
  Thread #2
    Lock being held:        0x215a0, at: grab_chopstick + 0x0000002C, line 106 in "din_philo.c"
    Lock being requested:   0x215b8, at: grab_chopstick + 0x0000002C, line 106 in "din_philo.c"
  Thread #3
    Lock being held:        0x215b8, at: grab_chopstick + 0x0000002C, line 106 in "din_philo.c"
    Lock being requested:   0x215d0, at: grab_chopstick + 0x0000002C, line 106 in "din_philo.c"
  Thread #4
    Lock being held:        0x215d0, at: grab_chopstick + 0x0000002C, line 106 in "din_philo.c"
    Lock being requested:   0x215e8, at: grab_chopstick + 0x0000002C, line 106 in "din_philo.c"
  Thread #5
    Lock being held:        0x215e8, at: grab_chopstick + 0x0000002C, line 106 in "din_philo.c"
    Lock being requested:   0x21600, at: grab_chopstick + 0x0000002C, line 106 in "din_philo.c"
  Thread #6
    Lock being held:        0x21600, at: grab_chopstick + 0x0000002C, line 106 in "din_philo.c"
    Lock being requested:   0x215a0, at: grab_chopstick + 0x0000002C, line 106 in "din_philo.c"

Deadlocks List Summary: Experiment: din_philo.1.er Total Deadlocks: 2
(er_print)
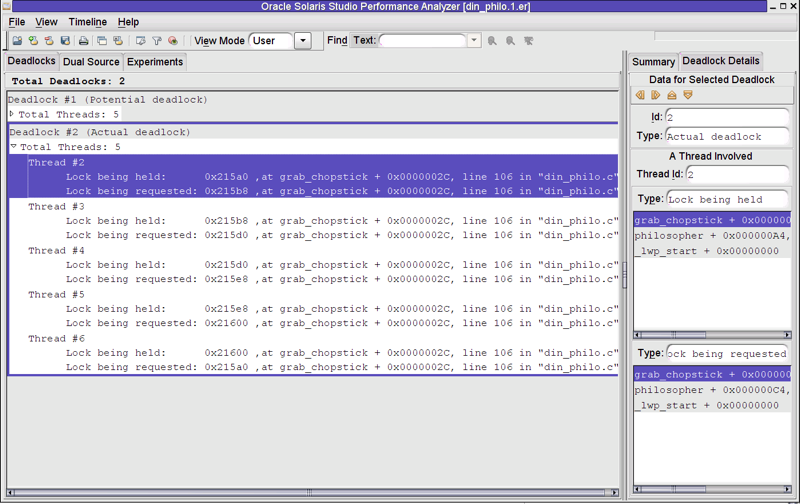
The following screen shot shows the Thread Analyzer's presentation of the deadlock information.
Figure 3-2 Deadlock Detected in din_philo.c

The Thread Analyzer reports two deadlocks for din_philo.c, one potential and the other actual. On closer inspection, you find that the two deadlocks are identical.
The circular chain involved in the deadlock is as follows:
|
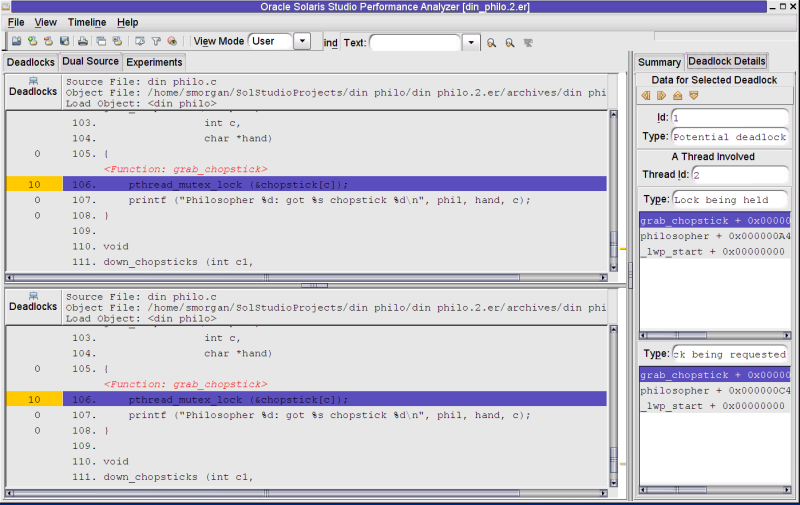
Select the first thread in the chain (Thread #2) and then click on the Dual Source tab to see where in the source code Thread #2 acquired the lock at address 0x215a0, and where in the source code it requested the lock at address 0x215b8.
The following screen shot shows the Dual Source tab for Thread #2. The top half of the screen shot shows that Thread #2 acquired the lock at address 0x215a0 by calling pthread_mutex_lock() on line 106. The bottom half of the screen shot shows that the same thread requested the lock at address 0x215b8 by calling pthread_mutex_lock() on line 106. Each of the two calls to pthread_mutex_lock() used a different lock as the argument. In general, the lock-acquire and lock-request operations may not be on the same source line.
The default metric (Exclusive Deadlocks metric) is shown to the left of each source line in the screen shot. This metric gives a count of the number of times a lock-acquire or lock-request operation, which was involved in a deadlock, was reported on that source line. Only source lines that are part of a deadlock chain would have a value for this metric that is larger than zero.
Figure 3-3 Potential Deadlock in din_philo.c

The dining philosophers program can avoid actual deadlock and terminate normally if you supply a large enough sleep argument. Normal termination, however, does not mean the program is safe from deadlocks. It simply means that the locks that were held and requested did not form a deadlock chain during a given run. If the timing changes in other runs, an actual deadlock can occur. The following listing shows a run of the dining philosophers program that terminates normally because of the 40 second sleep time. However, the er_print utility and the Thread Analyzer report potential deadlocks.
% cc -g -o din_philo_pt din_philo.c
% collect -r deadlock -o din_philo_pt.1.er din_philo_pt 40
Creating experiment database tha.2.er ...
Philosopher 0 is done thinking and now ready to eat.
Philosopher 2 is done thinking and now ready to eat.
Philosopher 1 is done thinking and now ready to eat.
Philosopher 3 is done thinking and now ready to eat.
Philosopher 2: got right  chopstick 2
Philosopher 3: got right  chopstick 3
Philosopher 0: got right  chopstick 0
Philosopher 4 is done thinking and now ready to eat.
Philosopher 0: got left chopstick 1
Philosopher 0: eating.
Philosopher 3: got left chopstick 4
Philosopher 3: eating.
Philosopher 0: got left chopstick 1
Philosopher 0: eating.
Philosopher 0: got right  chopstick 0
Philosopher 2: got left chopstick 3
Philosopher 2: eating.
...
Philosopher 4: got right  chopstick 4
Philosopher 3: got right  chopstick 3
Philosopher 2: got right  chopstick 2
Philosopher 4: got left chopstick 0
Philosopher 4: eating.
Philosopher 4 is done eating.
Philosopher 3: got left chopstick 4
Philosopher 3: eating.
Philosopher 0: got right  chopstick 0
Philosopher 0: got left chopstick 1
Philosopher 0: eating.
Philosopher 3 is done eating.
Philosopher 2: got left chopstick 3
Philosopher 2: eating.
Philosopher 0 is done eating.
Philosopher 2 is done eating.
Philosopher 1: got right  chopstick 1
Philosopher 1: got left chopstick 2
Philosopher 1: eating.
Philosopher 1 is done eating.
%

Execution terminated normally
Type the following commands shown in bold to examine the experiment with er_print utility:
% er_print din_philo_pt.1.er
(er_print) deadlocks
Deadlock #1, Potential deadlock
  Thread #2
    Lock being held:      0x215a0, at: grab_chopstick + 0x0000002C, line 106 in "din_philo.c"
    Lock being requested: 0x215b8, at: grab_chopstick + 0x0000002C, line 106 in "din_philo.c"
  Thread #3
    Lock being held:      0x215b8, at: grab_chopstick + 0x0000002C, line 106 in "din_philo.c"
    Lock being requested: 0x215d0, at: grab_chopstick + 0x0000002C, line 106 in "din_philo.c"
  Thread #4
    Lock being held:      0x215d0, at: grab_chopstick + 0x0000002C, line 106 in "din_philo.c"
    Lock being requested: 0x215e8, at: grab_chopstick + 0x0000002C, line 106 in "din_philo.c"
  Thread #5
    Lock being held:      0x215e8, at: grab_chopstick + 0x0000002C, line 106 in "din_philo.c"
    Lock being requested: 0x21600, at: grab_chopstick + 0x0000002C, line 106 in "din_philo.c"
  Thread #6
    Lock being held:      0x21600, at: grab_chopstick + 0x0000002C, line 106 in "din_philo.c"
    Lock being requested: 0x215a0, at: grab_chopstick + 0x0000002C, line 106 in "din_philo.c"

Deadlocks List Summary: Experiment: din_philo_pt.1.er Total Deadlocks: 1
(er_print)
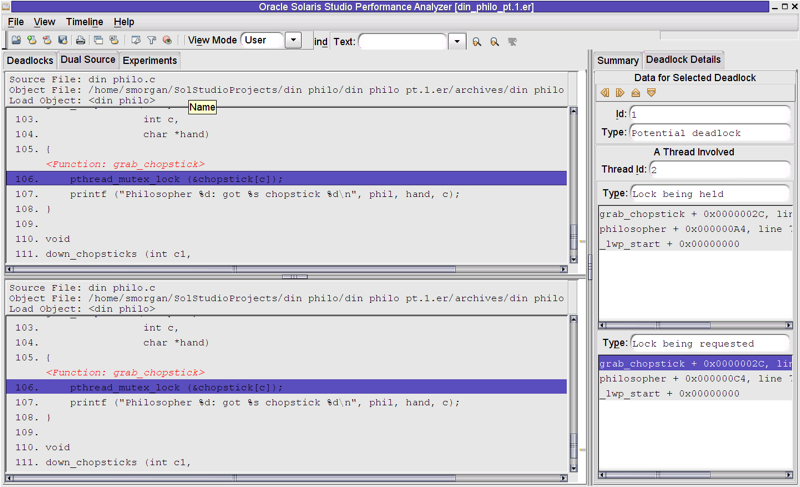
The following screen shot shows the potential deadlock information in the Thread Analyzer interface.
Figure 3-4 Potential deadlock in din_philo.c
