| Skip Navigation Links | |
| Exit Print View | |

|
Oracle Solaris Studio 12.3 Code Analyzer Tutorial Oracle Solaris Studio 12.3 Information Library |
| Skip Navigation Links | |
| Exit Print View | |

|
Oracle Solaris Studio 12.3 Code Analyzer Tutorial Oracle Solaris Studio 12.3 Information Library |
Getting the Sample Application
Collecting and Displaying Data
Collecting and Displaying Static Error Data
Collecting and Displaying Dynamic Memory Usage Data
Collecting and Displaying Code Coverage Data
Using the Issues Found by the Code Analyzer to Improve Your Code
December 2011
This tutorial uses a sample program to demonstrate how to use the Oracle Solaris Studio compilers, the Discover memory error discovery tool, the Uncover code coverage tool, and the Code Analyzer GUI to find and correct common programming errors, dynamic memory access errors, and code coverage issues.
The Oracle Solaris Studio Code Analyzer is an integrated set of tools designed to help developers of C and C++ applications for Oracle Solaris produce secure, robust, and quality software.
The Code Analyzer includes three types of analysis:
Static code checking as part of compilation
Dynamic memory access checking
Code coverage analysis
Static code checking detects common programming errors in your code during compilation. A new compiler option leverages the Oracle Solaris Studio compilers' extensive and well proven control and data flow analysis frameworks to analyze an application for potential programming and security flaws.
The Code Analyzer uses dynamic memory data collected by Discover, the memory error discovery tool in Oracle Solaris Studio, to find memory-related errors when you run your application. It uses data collected by Uncover, the code coverage tool in Studio, to measure code coverage.
In addition to giving you access to each individual type of analysis, the Code Analyzer integrates static code checking and dynamic memory access checking to add confidence levels to errors found in code. By using static code checking together with dynamic memory access analysis and code coverage analysis, you will be able to find many important errors in your applications that cannot be found by other error detection tools working by themselves.
This tutorial uses a sample program to demonstrate how to use the Oracle Solaris Studio compilers, the Discover memory error discovery tool, the Uncover code coverage tool, and the Code Analyzer GUI to find and correct common programming errors, dynamic memory access errors, and code coverage issues.
The source code for the sample program is available in the sample applications zip file on the Oracle Solaris Studio 12.3 Sample Applications web page at http://www.oracle.com/technetwork/server-storage/solarisstudio/downloads/solaris-studio-samples-1408618.html. If you have not already done so, download the sample applications zip file and unpack it in a directory of your choice.
The sample application is located in the CodeAnalyzer subdirectory of the SolarisStudioSampleApplications directory.
The sample directory contains the following source code files:
|
You can use the Code Analyzer tools to collect one, two, or all three types of data.
When you build a binary using the -xanalyze=code compiler option, the compiler automatically extracts static errors and puts the data in a static subdirectory in a binary_name.analyze directory in the same directory as the source code. For a list of the types of static errors found by the compiler, see Static Code Issues.
In your sample directory, build the application by typing:
cc -xanalyze=code *.c
The static error data is written to the static subdirectory in an a.out.analyze directory in your sample directory.
Open the Code Analyzer GUI to view the results:
code-analyzer a.out &
The Code Analyzer GUI opens and the Results tab displays the static code issues found during compilation. The text at the top of the Results tab tells you that twelve static code issues were found.
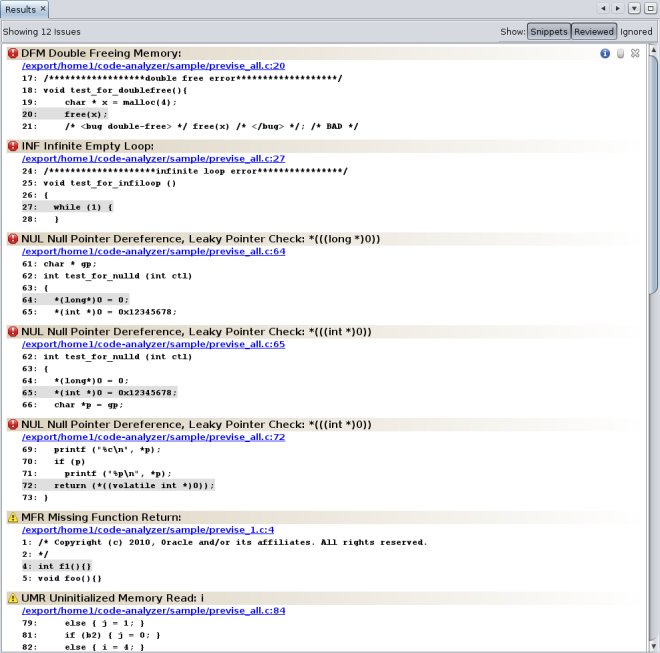
For each issue, the tab displays the issue type, the path name of the source file in which the issue was found, and a code snippet from that file with the relevant source line highlighted.
To see more information about the first issue, a Double Freeing Memory error, click the error icon ![]() . The stack trace for the issue opens displaying the error path.
. The stack trace for the issue opens displaying the error path.
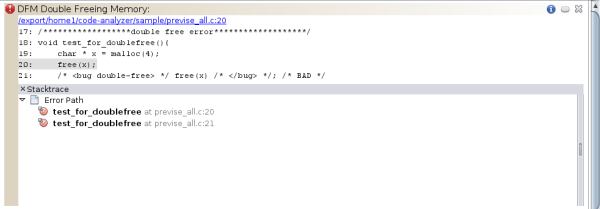
Notice that when you opened the stack trace, the icon in the upper right corner of the issue changed from ![]() to
to ![]() to indicate that you have reviewed the issue.
to indicate that you have reviewed the issue.
Note - You can hide the issues you have reviewed by clicking the Hide Reviewed Issues button ![]() at the top of the Results tab. Clicking the button again unhides the issues.
at the top of the Results tab. Clicking the button again unhides the issues.
Click the error icon to close the stack trace.
Now look at one of the Unitialized Memory Read warnings. Click the warning icon ![]() to open the stack trace. Notice that the error path for this issue contains many more function calls than the one for the Double Freeing Memory issue. Double click on the first function call. The source file opens with that call highlighted. The error path is displayed in a Details Window below the source code.
to open the stack trace. Notice that the error path for this issue contains many more function calls than the one for the Double Freeing Memory issue. Double click on the first function call. The source file opens with that call highlighted. The error path is displayed in a Details Window below the source code.
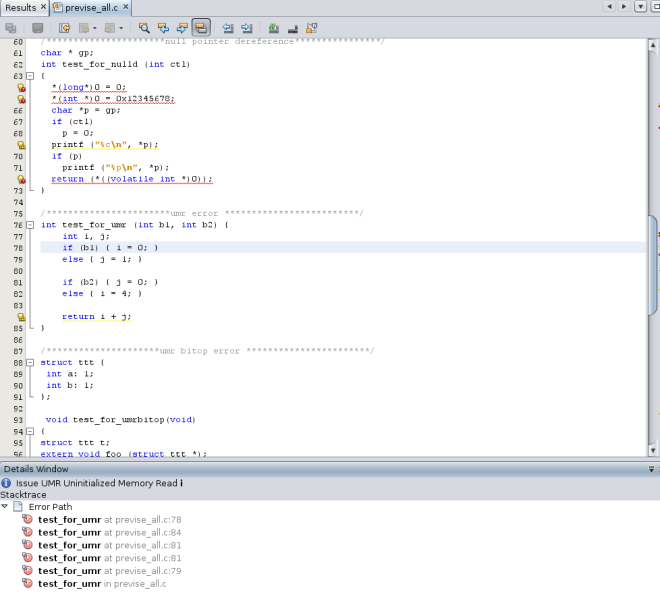
Double click the rest of the function calls in the error path to follow the path through the code that leads to the error.
To see more information about the UMR error type, click the Info button ![]() to the left of the issue description. A description of the error type, including a code example and possible causes, is displayed in the online help browser.
to the left of the issue description. A description of the error type, including a code example and possible causes, is displayed in the online help browser.
Close the Code Analyzer GUI.
Whether or not you have collected static data, you can compile, instrument, and run your application to collect dynamic memory access data. For a list of the dynamic memory access errors found by instrumenting your application with Discover and then running it, see Dynamic Memory Access Issues.
In your sample directory, build the sample application with the -g option. This option generates debug information that allows the Code Analyzer to display source code and line number information for errors and warnings.
cc -g *.c
You cannot instrument a binary that is already instrumented, so save a copy of the binary to use when you collect coverage data.
cp a.out a.out.save
Instrument the binary with Discover:
discover -a a.out
Run the instrumented binary to collect the dynamic memory access data.
./a.out
The dynamic memory access error data is written to the dynamic subdirectory in the a.out.analyze directory in your sample directory.
Open the Code Analyzer GUI to view the results:
code-analyzer a.out &
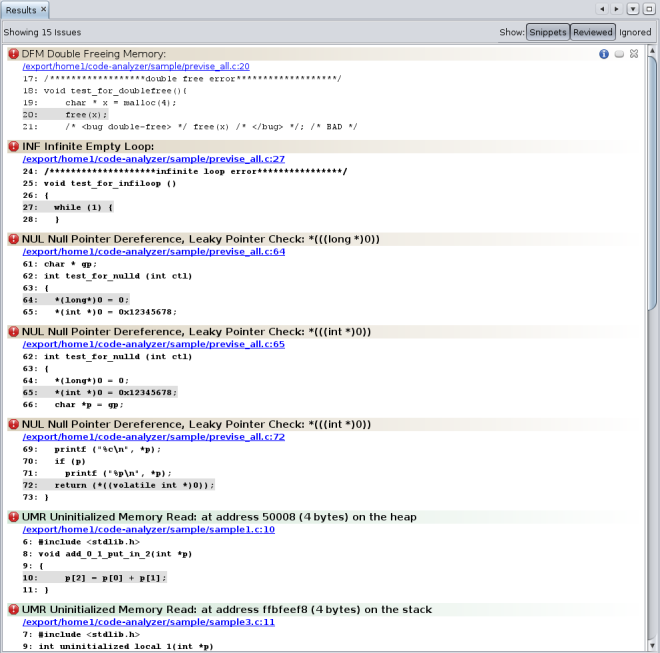
The Results tab now shows both static issues and dynamic memory issues. The background color behind an issue description indicates a static code issue (tan) or a dynamic memory access issue (pale green).
To filter the results and show just the dynamic memory issues, select the Dynamic checkbox on the Issues tab.
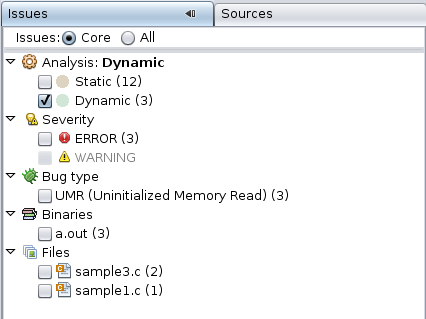
Now the Results tab shows just the three core dynamic memory issues.
Note - Core issues are the issues that, when fixed, are likely to eliminate the other issues. A core issue usually combines several of the issues listed on the All view because, for example, those issues have a common allocation point, or they occur at the same data address in the same function.
To see all of the dynamic memory issues, select the All radio button at the top of the Issues tab. Now the Results tab displays six dynamic memory issues.
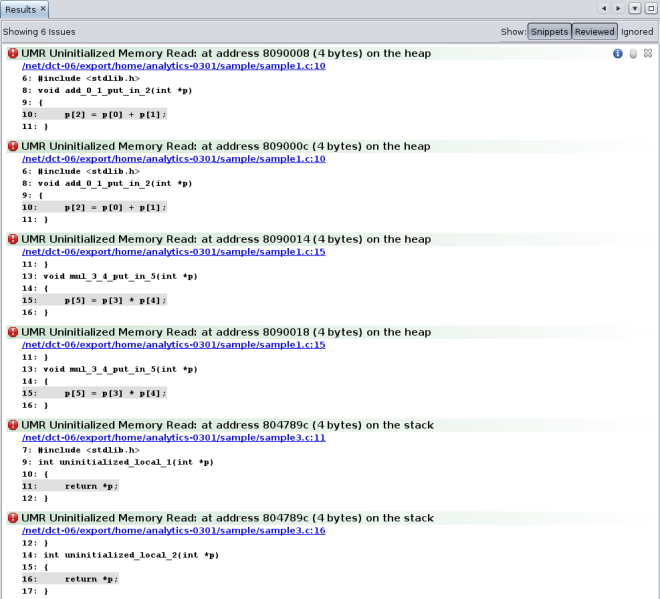
Look at the three issues that were added to the display and see how they are related to the core issues. It looks as though fixing the cause of the first issue in the display is likely to also eliminate the second and third issues.
To hide the other three dynamic memory access issues while you investigate these first one, click the Ignore button ![]() for each of the issues.
for each of the issues.
Note - You can later redisplay the closed issues by clicking the Show Ignored Issues button ![]() at the top of the Results tab.
at the top of the Results tab.
Investigate the first issue by clicking the error icon ![]() to display the stack trace. For this issue, the stack trace includes the Call Stack and the Allocated At Stack.
to display the stack trace. For this issue, the stack trace includes the Call Stack and the Allocated At Stack.
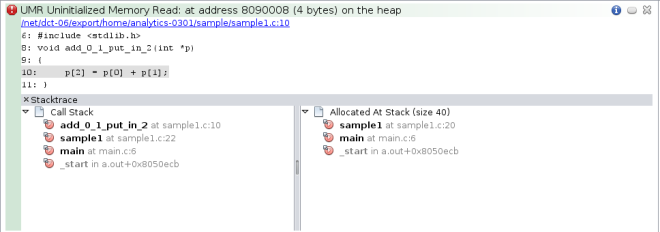
Double-click function calls in the stacks to see the associated lines in the source file. When the source file opens, the stack trace is displayed in a Details window below the file.
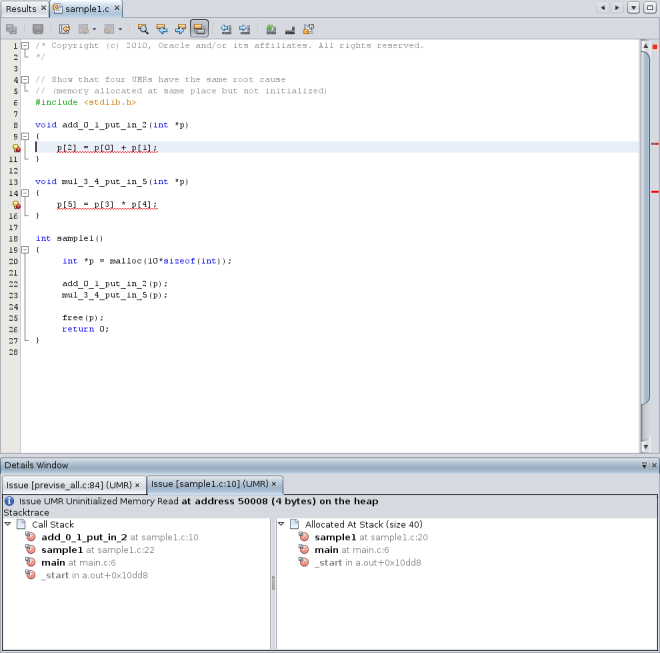
Close the Code Analyzer GUI.
Whether or not you have collected static data or dynamic memory access data, you can compile, instrument, and run your application to collect code coverage data.
Since you built the application with the -g option before you collected dynamic memory error data and saved a copy of the binary before instrumenting it, you can copy the saved binary to instrument for coverage data collection.
cp a.out.save a.out
Instrument the binary with Uncover:
uncover a.out
Run the instrumented binary to collect the code coverage data.
./a.out
The code coverage data is written to an a.out.uc directory in your sample directory.
Run Uncover on the a.out.uc directory.
uncover -a a.out.uc
The code coverage data is written to an uncover subdirectory in the a.out.analyze directory in your sample directory.
Open the Code Analyzer GUI to view the results:
code-analyzer a.out &
The Results tab now shows static issues, dynamic memory issues, and code coverage issues. To filter the results and show just the code coverage issues, select the Coverage checkbox on the Issues tab.
Now the Results tab shows just the twelve code coverage issues. The description of each issue includes a potential coverage percentage, which indicates the percentage of coverage that will be added to the total coverage for the application if a test covering the relevant function is added.
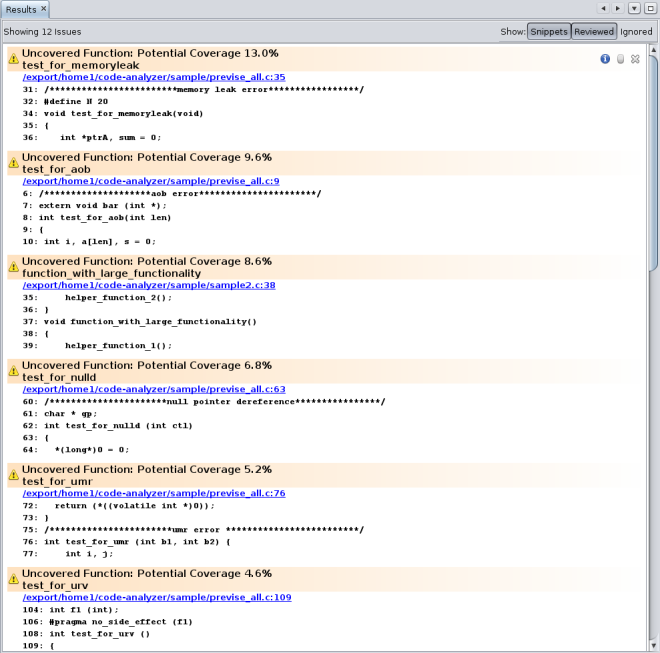
Note - To see all of the issues without scrolling up and down, click the Hide Snippets button ![]() at the top of the Results tab to hide the code snippets.
at the top of the Results tab to hide the code snippets.
In the Issues tab, notice that nine of the coverage issues are in the previse_all.c source file, three of them are in sample2.c, and one is in previse_1.c. To further filter the results and show just the issues for the sample2.c file, select the checkbox for that file on the Issues tab.
The Results tab now shows just the three code coverage issues found in sample2.c.
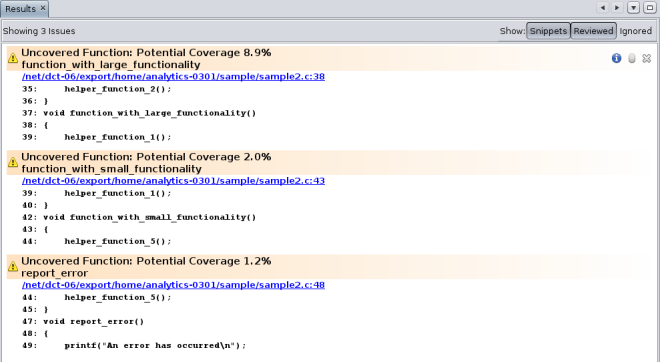
Open the source file by clicking on the source file path link in one of issues. Scroll down in the source file until you see the warning icons in the left margin.
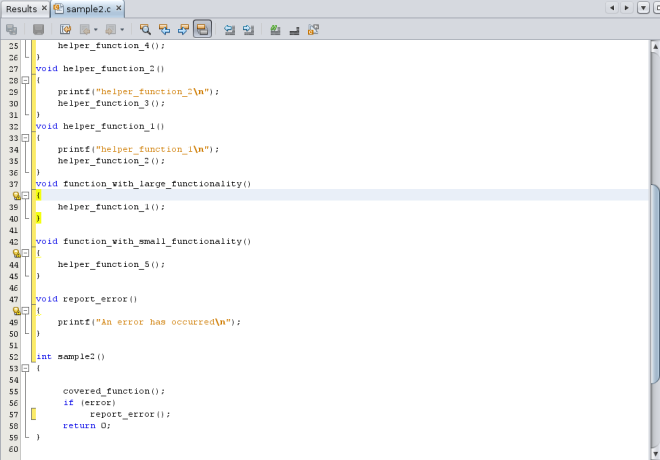
Code that is not covered is marked with a yellow bracket, for example ![]() . The coverage issues found in the file are marked with warning icons
. The coverage issues found in the file are marked with warning icons ![]()
By fixing the core issues found by the Code Analyzer, you should be able to eliminate the other issues found in your code, and make major improvements in its quality and stability.
By doing static error checking, you can find the risky code in your application. But static error checking can generate false positives. Dynamic checking can help verify and eliminate these errors, giving a more accurate picture of the issues in your code. And code coverage checking can help you improve your dynamic test suites.
The Code Analyzer integrates the results these three types of checking to give you the most accurate analysis of your code all in one tool.
The compilers, Discover, and Uncover find static code issues, dynamic memory access issues, and coverage issues in your code. The specific error types that are found by these tools and analyzed by the Code Analyzer are listed in the following sections.
Static code checking finds the following types of errors:
ABR: beyond Array Bounds Read
ABW: beyond Array Bounds Write
DFM: Double Freeing Memory
ECV: Explicit type Cast Violation
FMR: Freed Memory Read
FMW: Freed Memory Write
FOU: PM_OUT use before definition
INF: INFinite empty loop
Memory leak
MFR: Missing Function Return
MRC: Missing malloc Return value Check
NFR: uNinitialized Function Return
NUL: NULl pointer dereference, leaky pointer check
RFM: Return Freed Memory
UMR: Uninitialized Memory Read, Uninitialized Memoey Read bit operation
URV: Unused Return Value
VES: out-of-scope local Variable usage
Dynamic memory access checking finds the following types of errors:
ABR: beyond Array Bounds Read
ABW: beyond Array Bounds Write
BFM: Bad Free Memory
BRP: Bad Realloc address Parameter
CGB: Corrupted Guard Block
DFM: Double Freeing Memory
FMR: Freed Memory Read
FMW: Freed Memory Write
IMR: Invalid Memory Read
IMW: Invalid Memory Write
Memory leak
OLP: OverLaPping source and destination
PIR: Partially Initialized Read
SBR: beyond Stack Bounds Read
SBW: beyond Stack Bounds Write
UAR: UnAllocated memory Read
UAW: UnAllocated memory Write
UMR: Unitialized Memory Read
Dynamic memory access checking finds the following types of warnings:
AZS: Allocating Zero Size
Memory leak
SMR: Speculative unitialized Memory Read
Code coverage checking determines which functions are uncovered. In the results, code coverage issues found are labeled as Uncovered Function, with a potential coverage percentage, which indicates the percentage of coverage that will be added to the total coverage for the application if a test covering the relevant function is added.