Observers
This section provides information to help you administer Business Transaction Management observers and includes the following subsections:
About Observers
Observers are Business Transaction Management components that you install into the application server of business applications you want to monitor. The observers monitor messages and calls between the components of your business applications.
Observers contain one or more subcomponents called probes. Each probe provides the observer with the capability of monitoring a particular type of business component. The monitoring capabilities of an observer are, therefore, dependent on the collection of probes that it contains.
The following table lists the types of observers provided by Business Transaction Management, the probes contained within each observer, and the monitoring capabilities conferred on the observer by each of the probes.
Table 11-1 Available observers, the probes they contain, and the types of components they monitor.
| Observer | Probe | Component Monitored |
|---|---|---|
|
JavaEE |
EJB |
Enterprise JavaBean (EJB) |
|
- |
JAVA |
Java (monitors local Java method calls) |
|
- |
JAXRPC |
JAX-RPC (includes monitoring of JMS traffic that uses the JAX-RPC API) |
|
- |
JAXWS |
JAX-WS (includes monitoring of JMS traffic that uses the JAX-WS API) |
|
- |
JDBC |
JDBC (monitors Java database calls) |
|
- |
JMS |
JMS (monitors traffic that uses the JMS API) |
|
- |
RMI |
Remote method invocation (RMI) |
|
- |
WEB_APP |
Java servlet application |
|
OSB |
OSB |
OSB Proxy Service and OSB Business Service |
|
Oracle SOA Suite |
SOA_BIZRULE |
Oracle SOA Suite Business Rule |
|
- |
SOA_BPEL |
Oracle SOA Suite Business Process Execution language (BPEL) |
|
- |
SOA_BPMN |
Oracle SOA Suite Business Process Modelling Notation (BPMN) |
|
SOA_EDN |
Oracle SOA Suite Event Delivery Network |
|
|
- |
SOA_MEDIATOR |
Oracle SOA Suite Mediator |
|
- |
SOA_SPRING |
Oracle SOA Suite Spring bean |
|
- |
SOA_WS |
Oracle SOA Suite web service |
|
- |
SOA_WSA |
Oracle SOA Suite web service adapter |
|
- |
WEB_APP |
Java servlet application |
|
Oracle Fusion Applications |
ESS |
Oracle Enterprise Scheduling Service |
|
All probes in the JavaEE observer except JDBC |
Refer to the JavaEE observer |
|
|
- |
All probes in the SOA Suite observer (including the WEB_APP probe) |
Refer to the SOA Suite observer |
|
WCF |
WCF |
Microsoft WCF services |
|
ASP.NET |
ASP.NET |
Microsoft ASP.NET services |
A single observer installation can monitor any number of components that are running in the application server, as long as the observer contains the appropriate probes.
Observers communicate with the Business Transaction Management sphere by way of another Business Transaction Management component called the monitor. One of the jobs of the monitor is to distribute configurations to the observers. When an observer starts, it contacts the monitor and obtains a configuration. The observer periodically polls the monitor for updates to its configuration.
The observer configuration is generated from an observer communication policy. By default, an observer communication policy is applied to all monitors. This policy both configures the monitors and provides them with an observer configuration to distribute to their associated observers. You can edit this default policy and/or apply your own.
Once running, the observers measure various aspects of your business applications' message and/or call flow, such as throughput, fault count, and response time (for a complete list of measurements, see Chapter 5, "About Instruments"). The observers periodically send these measurements to the monitor for analysis and eventual storage in a database, as shown in the following diagram:
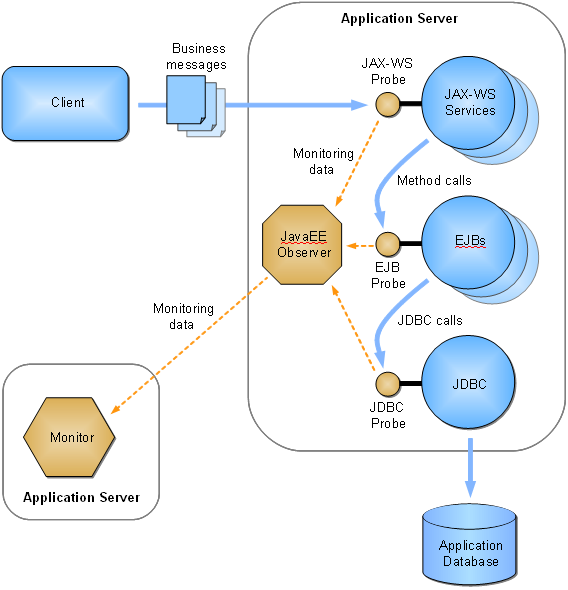
If configured to do so, the observers convert the various types of messages and calls into standardized XML-formatted messages for the purposes of message logging and further analysis. The observers forward these messages to the monitor. Note that these messages are copies, and that the original messages/calls are never altered or redirected.
Observers are installed into your business component's application server, and clients continue to access the business component in the same way as before the observer was installed. You can install any number of monitors, with any number of observers communicating with each monitor, but observers are never installed in the application server hosting the Business Transaction Management central servers or monitors.
For an overview of the entire Business Transaction Management system, see Architectural Overview. For information about scaling up your monitoring system by replicating the monitors, refer to the Business Transaction Management Installation Guide.
Configuring the Observer and Monitor
The Observer Communication policy sets up communication between observers and a monitor or monitor group. This policy configures both monitors and observers by:
-
setting up the observer-to-monitor communication channel
-
configuring the runtime settings for the observer
-
configuring the runtime settings for the monitor
Business Transaction Management is preconfigured with a default Observer Communication policy already applied. This default policy applies to all monitors registered in the system. If necessary, you can edit this default policy and/or create a new policy.
To edit the default Observer Communication policy instance:
-
Select Administration > System Policies in the Navigator.
-
Select the Default Observer Communication Policy in the summary area.
-
Choose Modify > Edit Definition for Default Observer Communication Policy.
To create a new instance of an Observer Communication policy:
Choose Admin > Create System Policy > Observer Communication.
Common Tasks
The following are common configuration tasks you can perform using this policy:
-
Logging observed messages and observer errors (see Observer Troubleshooting)
-
Adjusting message size and queue behavior on the monitor (see Monitor Message Queue)
-
Adjusting message size and queue behavior on the observer (see Observer Message Queue)
-
Enabling/Disabling Drilldowns from Real User Experience Insight
-
Request Monitoring and Operation Modeling for the WEB_APP Probe
A field reference for the policy's advanced settings is provided in Advanced Settings Field Reference.
Activating and Deactivating Probes
Observers contain different types of probes for monitoring the various types of components that make up your business applications. You can use this policy to individually activate or deactivate probes contained within the observers installed on your system.
The Active Probes section of the policy provides an Enable Discovery and Monitor Upon Discovery checkbox for each type of probe.
Select the Enable Discovery checkbox to activate the discovery mechanism for the associated component type. Components of that type are then discovered and displayed in the Management Console the next time they receive a message or call.
Select the Monitor Upon Discovery checkbox for a component type if you want to immediately begin monitoring components of that type as they are discovered.
Note:
If you enable discovery but not monitoring and then later edit the policy and enable monitoring, the system will not begin monitoring previously discovered components. The system will begin monitoring only the components discovered after you enable monitoring. For information on enabling monitoring for previously discovered components, see the topic Start and Stop Monitoring.Setting up the Observer-to-Monitor Communication Channel
The default policy sets up direct communication between the observer and monitor. Direct communication allows you to use multiple singleton monitors, with each monitor collecting observations from multiple observers.
If you intend to replicate the monitor by placing a load balancer in between the observers and a group of replicated monitors, you must set the values of the following fields in the Communication Channel section as indicated:
| Field Name | Value |
|---|---|
| Communication path | If your observers will communicate through a load balancer to a monitor group, choose Through router to monitor group. This choice displays the following fields in the policy |
| Router IP address | Specify the IP address of the load balancer that will receive the observation messages. |
| Router port number | Specify the port number on which the load balancer will receive the observation messages.
Note: You must also configure this port on your router. |
| Monitor port number | Specify the port number on which the monitors will receive the forwarded observation messages. |
For more information on this topic, refer to the Business Transaction Management Installation Guide.
Enabling SSL on the Observation Message Flow
The default Observer Communication policy sets up an unsecured socket connection that is used for sending observation messages from the observer to the monitor. If you prefer to use a secure socket (SSL) for this connection, enable the policy's Enable SSL checkbox and then use the following fields to specify the information needed for enabling the SSL connection:
| Field Name (boldface denotes a section name) | Description |
|---|---|
| Protocol | Required if displayed. Select the SSL protocol. Choices are TLSv1, SSLv3, or Any. SSLv3 is not supported by the .NET observers. This field configures both monitors and observers. |
| Use Default Stores | This checkbox is enabled by default.
Leave this checkbox enabled if you want to use the built-in, preconfigured security stores. In this case, you are finished if you are using Java-based observers only. If you are using .NET-based observers, you must also deploy a preconfigured certificate to the machines hosting the observers. You can find the preconfigured certificate at nanoagent\config\ssl\server.cer in the observer installation directory. Refer to the Business Transaction Management Installation Guide for more information on deploying the preconfigured certificate. Disabling this checkbox displays additional fields and permits you to specify your own security stores. |
| Monitor | ---------- This is a section label----------
The following five fields pertain to the monitor's key store. All of the following fields are displayed only if the Use Default Stores checkbox is disabled. |
| Key Store Location | Required if displayed. Specify the location of the monitor's SSL key store. You can specify this location as either an absolute path, if the key store file is local to your monitor, or as an HTTP(S) URL, if the file is accessible by HTTP GET.
The initial value when you open a new policy is AP-MONITOR-SSL:DefaultKeyStore.ks. This value points to the built-in, preconfigured key store located at WEB-INF/ssl/DefaultKeyStore.ks in the btmmonitor.war deployment. |
| Key Store Password | Required if displayed. Specify the password for accessing the SSL key store. |
| Key Store Type | Required if displayed. Specify the type of JCE (Java Cryptographic Extensions) key store for the monitor to use, for example, JKS, JCEKS, or PKCS12. The initial value is JKS. |
| Key Name | Required if displayed. Specify the certificate and private key. You can enter a key alias or a certificate attribute of the form CN=value, UID=value, etc. |
| Key Password | Required if displayed. Specify the password for accessing the certificate and private key. If unspecified, the password for the key store is used. |
| Auto-Dispatch Trust Store to Java Observers | If this checkbox is enabled, the monitor will serialize the trust store, and automatically send it to all associated Java observers. This option is ignored for .NET observers. This checkbox is disabled by default. |
| Auto-Dispatch Java Trust Store | ---------- This is a section label ----------
The following three fields pertain to the auto-dispatched trust store and are displayed only if the Auto-Dispatch Trust Store to Java Observers checkbox is enabled. |
| Trust Store Location | Required if displayed.
Specify the location of the SSL trust store that the monitor will dispatch to Java observers. You can specify this location as either an absolute path, if the trust store file is local to your monitor, or as an HTTP(S) URL, if the file is accessible by HTTP GET The initial value when you open a new policy is AP-MONITOR-SSL:DefaultTrustStore.ks. This value points to the built-in, preconfigured trust store located at WEB-INF/ssl/DefaultTrustStore.ks in the btmmonitor.war deployment. |
| Trust Store Password | Required if displayed. Specify the password for accessing the SSL trust store that the monitor will dispatch to Java observers. |
| Trust Store Type | Required if displayed. Specify the type of JCE (Java Cryptographic Extensions) trust store that the monitor will dispatch to Java observers, for example, JKS, JCEKS, or PKCS12. The initial value is JKS. |
| Java Observer | ---------- This is a section label ----------
The following three fields pertain to manually installed trust stores and are displayed only if the Auto-Dispatch Trust Store to Java Observers checkbox is disabled. |
| Trust Store Location | Required if displayed.
Specify the location of the SSL trust store to be used by observers deployed to Java execution environments. You can specify this location as either an absolute path, if the trust store file is local to your observer, or as an HTTP(S) URL, if the file is accessible by HTTP GET. The initial value when you open a new policy is AP-OBSERVER-SSL:DefaultTrustStore.ks. This value points to the built-in, preconfigured trust store located at nanoagent\config\ssl\DefaultTrustStore.ks in the observer installation directory. |
| Trust Store Password | Required if displayed. Specify the password for accessing the SSL trust store. |
| Trust Store Type | Required if displayed. Specify the type of JCE (Java Cryptographic Extensions) trust store that the monitor will dispatch to Java observers, for example, JKS, JCEKS, or PKCS12. The initial value is JKS. |
Enabling/Disabling Drilldowns from Real User Experience Insight
You can control the ability of users to perform user-interface drilldowns from Oracle Enterprise Manager Real User Experience Insight into Business Transaction Management. By default, drilldown capability is enabled. To disable or re-enable drilldown capability, set the WEB_APP probe's rueiPresent attribute as described in Request Monitoring and Operation Modeling for the WEB_APP Probe.
Request Monitoring and Operation Modeling for the WEB_APP Probe
The WEB_APP probe lets you monitor web applications that are implemented as Java servlets. This probe provides a generic form of processing that can be used with all types of Java servlets and a specialized form of processing optimized for use with Oracle Application Development Framework (ADF) applications. This section refers to these different types of processing as rulesets. The generic type of processing is referred to as the URL ruleset, and the type of processing used for ADF applications is referred to as the ADF ruleset. The URL ruleset is used by default.
Unless configured otherwise, the WEB_APP probe monitors all requests to the web applications in the monitored application server. In many cases, however, you might not want to monitor all requests. For example, you might not want to monitor requests for static resources such as image and HTML files. For this reason, the default Observer Communication policy is configured not to monitor requests for resources that have the following file extensions: jpg, jpeg, html, htm, css, gif, png, ico, js, swf, cur. This selective monitoring is specified by way of a snippet of XML configuration code that appears in the default policy's WEB_APP probe configuration field.
You can edit this default XML configuration code in order to control the types of requests that are monitored. You can also add XML elements to control how your application's operation names are abbreviated for display in the Management Console (operation names are derived from request URLs). The following table describes the XML elements and attributes that you can use in your configuration code. Usage examples are provided after the table.
Note: Ordering of the XML elements is critical. The required ordering of the elements is described in the table. Incorrect ordering will cause the policy to be rejected.
| Element | Attribute | Description | Supported rulesets |
|---|---|---|---|
| servletObserver | - | Encompassing tag containing configuration information for all applications monitored by the WEB_APP probe. There is only one <servletObserver> element. | ADF URL |
| - | rueiPresent | Indicates that Oracle Enterprise Manager Real User Experience Insight is installed in front of the monitored applications. This attribute controls the ability of users to perform user-interface drilldowns from Real User Experience Insight into Business Transaction Management.
Valid values are true and false. The default setting is true. When this attribute is set to true, Business Transaction Management adds headers to the HttpResponse, thereby enabling drilldown capability. To disable drilldown capability, set this attribute to false. |
ADF URL |
| - | rueiMatches | Indicates that the Real User Experience Insight naming scheme matches the Business Transaction Management naming scheme. Valid values are true and false. | ADF URL |
| globalExcludeList | - | This element is a list of file extensions and/or web module context roots to exclude from monitoring.
Element ordering: If used, you must place this element as the first child of the <servletObserver> element. There can be only one per <servletObserver>. |
ADF URL |
| - | ext | The comma delimited list of file extensions to exclude from monitoring, for example, "html, htm, jpg, css". | ADF URL |
| - | contextRoot | The comma delimited list of context roots to exclude from monitoring, for example, "console, medrec, bookmart". | ADF URL |
| application | - | Denotes an application to be monitored.
Element ordering: This element is a child of the <servletObserver> element. It must not precede the <globalExcludeList> element. There can be any number per <servletObserver> element. |
ADF URL |
| - | contextRoot | The context root of the monitored application. The value of this attribute is used as the service name. | ADF URL |
| framework | - | This element is used to specify which URLs should be handled by which ruleset by way of the <include> child element.
Element ordering: If used, you must place this element as the first child of the <application> element. There can be one for each ruleset type per <application> element. |
ADF URL |
| - | type | Specifies the ruleset that should handle the <include> URL patterns. Valid values are ADF and URL. For ADF web applications, set this attribute to ADF. For other web applications, set this attribute to URL.
The requests processed by each ruleset are mutually exclusive. If no <framework> tag is specified, the URL ruleset is used by default. If any <framework> tag is specified, no default will be used. |
ADF URL |
| include | - | This element allows you to include only requests matching the given wild card expression when mapping a request to a ruleset.
Element ordering: This element is a child of the <framework> element. There can be many per <framework> element. |
ADF URL |
| - | pattern | The URL pattern to match. Wild cards are allowed and denoted using "*". | ADF URL |
| excludeList | - | This element is a list of file extensions to exclude from monitoring.
Element ordering: This element is a child of the <application> element. It must follow all <framework> elements and precede all <operationRule> elements. There can be only one per <application> element. |
ADF URL |
| - | ext | The comma delimited list of file extensions to exclude from monitoring, for example, "html, htm, jpg, css". | ADF URL |
| operationRule | - | This element specifies the parts of the URL for which a unique combination of values will constitute an operation. Use this element to abbreviate the operation name that is derived from the URL.
Element ordering: This element is a child of the <application> element. It must not precede any <excludeList> or <framework> elements. There can be only one per <application> element. |
ADF URL |
| - | excludeDirectories | Comma separated list of directory levels to exclude from the operation name. For example, you could exclude "/faces" or the session ID. Note that the context-root is not considered a directory level. Also, the excludeDirectories count starts with "1", not "0". | ADF URL |
| partitionByParam | - | This element partitions an operation based on the value of the specified request parameter. Each unique parameter value is modeled as a separate operation. The parameter can be either a URL parameter or a POST parameter.
For example, assume we have an orderApplication.jsp that takes a parameter named action. Normally, requests to orderApplication.jsp would be modeled as requests to a single operation named orderApplication.jsp. However, if we use <partitionByParam> and partition by the action parameter, all requests to orderApplication.jsp that contain an action parameter will be modeled as requests to an operation named orderApplication.jsp_action_paramValue, where paramValue is the value of the action parameter. And, importantly, requests containing an action parameter will not be counted as requests to the operation orderApplication.jsp. (See also, "Example 2 – Adding a parameter name/value pair to an operation name".) Note: Using this element to partition an operation that is used in an existing transaction definition will change the semantics of the transaction. For example, requests that contain the specified parameter will no longer be counted as requests for the original operation and, therefore, will not belong to the transaction. You might need to update the definition of your transaction accordingly. Element ordering: If used, you must place this element as the first child of the <operationRule> element. There can be only one per <operationRule>. Note: This element does not support ADF page input parameters. |
ADF URL |
| - | name | The name of the parameter upon which to partition requests. Each distinct value of the given parameter corresponds to its own operation. The parameter is post-fixed onto the operation name as "_name_value", where name is the name of the parameter and value is its value. | ADF URL |
| secureParam | - | This element represents a URL or POST parameter whose value should be kept hidden or not get stored at all (for example, a password), both in operation names and in Business Transaction Management messages.
Element ordering: This element is a child of the <operationRule> element. It must not precede the <partitionByParam> element. There can be any number per <operationRule> element. |
ADF URL |
| - | name | The name of the parameter whose value should be hidden or not stored at all. | ADF URL |
Note:
Service and operation names are derived from the request URL. In order to conform to XML standards, the probe substitutes an underscore symbol ("_") in place of special characters such as slashes, question marks, and equal signs ("/", "?", "=").Example 1 – Abbreviating an operation name
<ap:servletObserver xmlns:ap="http://namespace.amberpoint.com/amf">
 <ap:application contextRoot="/mywebshop">
  <ap:operationRule excludeDirectories="1, 2" />
 </ap:application>
</ap:servletObserver>
The preceding configuration code applied to this request URL:
http://secure.banking.de:7001/mywebshop/shopping/s28373/basket/checkout.jsp
produces the following objects in Business Transaction Management:
| Object | Value | Explanation |
|---|---|---|
| Service | mywebshop | The service name is the value of the contextRoot attribute. |
| Endpoint | http://secure.banking.de:7001/mywebshop | The endpoint is the physical location of the monitored web application plus the service name (the value of the contextRoot attribute). |
| Operation | basket_checkout.jsp | By default, the operation name consists of the directories and filename from the request URL. In this case, the default operation name would be shopping/s28373/basket/checkout.jsp. However, because the <operationRule> element's excludeDirectories attribute is set to "1, 2", the first and second directories (shopping/s28373/) are excluded. |
Example 2 – Adding a parameter name/value pair to an operation name
<ap:servletObserver xmlns:ap="http://namespace.amberpoint.com/amf">
 <ap:application contextRoot="/physician">
  <ap:operationRule>
   <ap:partitionByParam name="lastName"/>
  </ap:operationRule>
 </ap:application>
</ap:servletObserver>
The preceding configuration code applied to this request URL:
http://stbdm02:7011/physician/physicianSection/viewRecordSummary.action
with a POST parameter of lastName=Einstein, produces the following objects in Business Transaction Management:
| Object | Value | Explanation |
|---|---|---|
| Service | physician | The service name is the value of the contextRoot attribute. |
| Endpoint | http://stbdm02:7011/physician | The endpoint is the physical location of the monitored web application plus the service name (the value of the contextRoot attribute). |
| Operation | physicianSection_viewRecordSummary.action_lastName_Einstein | The name and value of the parameter specified by the <partitionByParam> element is appended to the default operation name. |
Example 3 – Filtering requests and applying rulesets
<ap:servletObserver xmlns:ap="http://namespace.amberpoint.com/amf">
 <ap:application contextRoot="/em">
  <ap:framework type="ADF">
   <ap:include pattern="*/faces*"/>
  </ap:framework>
  <ap:framework type="URL">
   <ap:include pattern="*/console*" />
  </ap:framework>
  <ap:operationRule excludeDirectories="1, 2" />
 </ap:application>
</ap:servletObserver>
The preceding configuration code applied to these request URLs:
http://myhost:17861/em/faces/ocamm/managers/ocammHome
http://myhost:17861/em/console/all/targets/search
http://myhost:17861/em/em2go/about.jsp
produces the following objects in Business Transaction Management:
| Object | Value | Explanation |
|---|---|---|
| Service | em | The service name is the value of the contextRoot attribute. |
| Endpoint | http://myhost:17861/em | The endpoint is the physical location of the monitored web application plus the service name (the value of the contextRoot attribute). |
| Operation | ocammHome | (This pertains to the first example URL)
Because the <framework> element's type is set to ADF, the ADF ruleset is used. Therefore, by default, the operation name consists of the directories and filename from the request URL. In this case, the default operation name would be console/all/targets/search. However, because the <operationRule> element's excludeDirectories attribute is set to "1, 2", the first and second directories (console/all/) are excluded. Under the ADF ruleset, the operation name is the view ID of the page, which is ocammHome. |
| Operation | targets_search | (This pertains to the second example URL)
Because the <framework> element's type is set to URL, the URL ruleset is used. Therefore, by default, the operation name consists of the directories and filename from the request URL. In this case, the default operation name would be console/all/targets/search. However, because the <operationRule> element's excludeDirectories attribute is set to "1, 2", the first and second directories (console/all/) are excluded. |
| N/A | N/A | (This pertains to the third example URL)
A <framework> element of type URL was specified with only the pattern "*/console*". This request does not fit that pattern. It also does not fit the pattern specified in the ADF <framework> element. Thus it is excluded from monitoring. |
Info Settings Field Reference
| Field Name | Description |
|---|---|
| Name | Required. The name of your policy. You can set this field to any unique string. |
| Version | Optional. This field is descriptive only and is provided for you to enter any pertinent information about the policy. |
| Notes | Optional. This field is descriptive only and is provided for you to enter any pertinent information about the policy. |
Advanced Settings Field Reference
| Field Name (boldface denotes a section name) | Description |
|---|---|
| Edit advanced options | Enable this checkbox to display advanced settings. The advanced settings are described below. |
| Observer Behavior | All of the following settings are displayed only if you enable the Edit advanced options setting. |
| Configuration polling interval | Required. Use this field to specify, in seconds, how often the observer checks for a new configuration. |
| Instrument update interval | Required. Use this field to specify, in seconds, how often the observer sends measurement data to the monitor. |
| Number of connections | Use this field to specify the number of socket connections that the observer opens. Using multiple connections improves throughput of observations. |
| Mapping Algorithm | Specifies the algorithm used to modify the host name-port number portion of the request and WSDL URLs. Choose from these values:
As sent - The observer does not rewrite the URL and forwards it unchanged to the monitor. Use hostname - The observer replaces the host name portion of the URL with the fully qualified name of the server's host. It replaces the port number portion of the URL with the port number on which the server is listening. The host name and port number are obtained from the deployment environment. This algorithm is useful for clustered servers fronted by a load balancer. In this scenario, the original request URL is that of the load balancer, with the load balancer's host name and port number. If the observer passes the original request URL to the monitor, the entire cluster of servers is modelled as a single server. With the algorithm set to useHostname, each server is modelled separately. Use IP address - The observer converts the URL's host name into an IP address and leaves the port number unchanged. The IP address is obtained from the deployment environment. This algorithm can be useful if the monitor cannot resolve hostnames to valid IP addresses. You should not use this algorithm if the server has multiple IP addresses. Use fully qualified name (FQN) - The observer converts the URL's host name into a fully qualified name and leaves the port number unchanged. This algorithm can be useful for a server that has multiple IP addresses. Use alternate - This algorithm lets you provide specific values for the host name, port number, and protocol. Use the following three fields to input the values. If you do not specify a value in any one of the fields, the corresponding portion of the URL is left unchanged. Note: In the case of the OSB observer, the target service URL is always set to FQN in the observer configuration, but this setting is not visible in this policy. |
| Alternate host | The value to use as the host portion of the URL. |
| Alternate port | The value to use as the port number portion of the URL. |
| Alternate protocol | The value to use as the protocol portion of the URL. |
| Observer Troubleshooting | - |
| Enable trace logging | Trace logging is always enabled and is set to Info by default. Use this checkbox to enable the Trace logging level field so that you can edit the setting.
For information on other types of observer error logging, location of error log files, and configuring the location of error logs, see the topic, Logging observer errors and debugging information. |
| Trace logging level | Use this field to specify the level of information you want written to the log file. The possible values, in order from least to most information, are:
Info, Fine, Finer, Finest |
| Trace file size | This field specifies, in kilobytes, the size of the trace log files. |
| Trace files count (rotation) | This field specifies the maximum number of trace log files. When the maximum number of trace log files are full, rotation occurs, whereby the oldest file is overwritten with a new file.
In general, you will change this setting only when asked to do so by the Oracle support team. |
| Log observed messages to file | Enable this checkbox if you want observed messages written to a file. |
| Observation log directory | The path to the directory containing the observation log files. You can specify an absolute path or a relative path. If you specify a relative path, the path is relative to the default location. The default location is:
Note: The default log location for WCF and ASP.NET is not a true default. It is simply the default setting of the AmberPoint:NanoLogBaseDir key. If you set this key to null, log files will not be created. |
| Observer Message Queue | The fields in this section affect the behavior of the observer's observation queue. The observer copies observed, service-bound messages to this outgoing queue. These observations are then pulled off the queue and sent to the monitor. |
| Queue size | Required. This field specifies the maximum number of messages the observer's observation queue can hold. A larger number allocates more memory for the queue. |
| Maximum message size | Optional. This field specifies, in kilobytes, the maximum size of a message that can be placed on the observer's observation queue. Messages larger than the specified size are first truncated and then placed on the queue.
You can use this field to reduce the load on the network and monitor. The truncation applies only to the body of the message. The message envelope is left intact. Note: If your service is a client to other services, you must set this setting to the same value for the observers monitoring those services. Failure to do so will disrupt the dependency tracking mechanism and cause the appearance of nonexistent clients in dependency diagrams. |
| If queue is full | Caution: Leave this field at its default setting unless you are instructed by the Oracle support team to edit it. The default setting for this field is Forward service-bound messages without copying them onto queue.
The If queue is full field specifies the behavior of the observer's observation queue if it fills up. Choose between these options: Delay service-bound messages until there is room to copy them onto queue - If the queue is full, the observer waits until the queue frees up enough space to hold the observation before forwarding the original message on to the service. This setting ensures that copies of all messages are forwarded to the monitor. Choosing this option together with the Delay receipt of observed messages over socket until queue has room option in the Monitor Configuration section of the policy ensures that all observations are logged. However, in high-traffic situations, such a setting might result in the slowing down of message processing by the monitored application. Forward service-bound messages without copying them onto queue - If the queue is full, the observer forwards the original message on to the service without copying it to the queue. Choosing this option ensures that the observer does not slow down the monitored application's message processing in order to log observations. However, in high-traffic situations, this setting might result in a loss of observations. Note: In no case, does the observer discard the original service-bound messages. |
| Monitor Message Queue | The fields in this section affect the behavior of the monitor's observation queue. As observations arrive at the monitor, they are placed on this incoming queue. The monitor then pulls the observations off the queue and processes them in order to gather data on performance, transactions, and so forth. |
| Queue size | Required. This field specifies the maximum number of messages the monitor's observation queue can hold. A larger number allocates more memory for the queue. |
| Maximum message size | Optional. This field specifies, in kilobytes, the maximum size of messages that are accepted on the monitor's observation queue. You can use this field to reduce the load on the monitor by constraining the processing of large messages.
By specifying a value in this field, you instruct Business Transaction Management to drop both the request and response message (or fault message, in case of a fault) if either message in the pair is larger than the specified value. Oversized messages are dropped without being processed and are not used in calculating performance measurements such as throughput or average response time. |
| Idle socket timeout | Required. This field specifies the maximum number of milliseconds that the socket on which the monitor receives observations remains open in the absence of traffic. |
| Retain request messages for a maximum of | Optional. This setting specifies the number of seconds the monitor holds on to a request message before assuming that no response will arrive. Once this time has been exceeded, the request is processed as if the response message timed out. The default value of 60 seconds is used if you leave this field blank or set it to 0. |
| Number processing threads handling messages | Optional. This field specifies the number of threads the monitor allocates for processing observation messages. The default value of 5 is used if you leave the field blank or set it to 0. |
| Number processing threads handling endpoint discovery | Optional. This field specifies the number of threads the monitor allocates for processing endpoint discovery messages. The default value of 2 is used if you leave the field blank or set it to 0. |
| If queue is full | Required. This field specifies the behavior of the monitor's observation queue if it fills up. Choose between these options:
Delay receipt of observed messages over socket until queue has room - If full, the queue rejects incoming observations (message copies) until it has freed up space for them. In this case, the observer resends observations until they are successfully placed on the queue. Choosing this option together with the Delay service-bound messages until there is room to copy them onto queue option in the Observer Configuration section of the policy ensures that all observations are logged. However, in high-traffic situations, such a setting might result in the slowing down of message processing by the monitored application. Discard incoming observed messages - If full, the queue discards incoming observations. Choosing this option together with the Forward service-bound messages without copying them onto queue option in the Observer Configuration section of the policy ensures that the observer does not slow down the monitored application's message processing. However, in high-traffic situations, this setting might result in a loss of observations. Note: In no case, does the monitor discard the original application messages. |
| Servlet Observer Configuration | - |
| Specify WEB_APP probe configuration | This checkbox pertains to the WEB_APP probe and allows you to configure the selective monitoring of requests and modeling of operations. Enable this checkbox to display the WEB_APP probe configuration field, where you can input configuration code for these options. This field is enabled by default.
Note: If you provide a custom observer configuration in the Custom observer configuration field, do not enable this checkbox. Instead, you must add your filtering/modeling code to your custom observer configuration in the Custom observer configuration field. This code must be contained in a <servletObserver> element and added as the last child of the custom configuration's <nanoAgentConfigurations> element (the root element in the custom configuration.) |
| WEB_APP probe configuration | This field is displayed only if the Specify WEB_APP probe configuration checkbox is enabled.
Use this field to input a <servletObserver> element into the configuration for the WEB_APP probe. This element provides control over the selective monitoring of requests and the modeling of operations. By default, this field contains the following code, which instructs the probe not to monitor requests for files with the specified extensions. <ap:servletObserver rueiPresent="true" rueiMatches="false" xmlns:ap="http://namespace.amberpoint.com/amf"> <ap:globalExcludeList ext="jpg, jpeg, html, htm, css, gif, png, ico, js, swf, cur"/> </ap:servletObserver> For information on coding the <servletObserver> element, see Request Monitoring and Operation Modeling for the WEB_APP Probe. |
| Custom Observer Configuration | - |
| Use custom configuration | If you require observer configuration options that are not available in this policy, enable this checkbox and input your observer configuration in the following field. With this checkbox enabled, your custom configuration overrides all other fields in this policy. |
| Custom observer configuration | Use this field to input a custom observer configuration. This field is displayed only if the Use custom configuration checkbox is enabled. |
| Model Configuration | The fields in this section control how Business Transaction Management models particular types of components.
Note: These fields should be adjusted to the proper setting before the observer is installed. You should not edit these settings for components that have already been discovered, except under the guidance of Oracle technical support. |
| SOA | This field controls how SOA components are modeled. Choose between these options:
Model All - Model all SOA components. This is the default setting. Model Edge of Flow - Model only the first component of each SOA composite application, for example, a web service interface. |
| Local EJB | This field controls how local EJB components are modeled. It does not affect the modeling of remote EJB components. Choose between these options:
Model All - Model all local EJB components. This is the default setting. Model None - Do not model local EJB components. Model Edge of Flow - Model only the first local EJB component of each local request flow. |
| OSB | This field is not operational for observers up to and including the release 12.1.0.2.4 observer. |
Logging Observer Errors and Debugging Information
The observer writes error and debugging information to the following log files:
NanoAgentStartupErrors.log – contains configuration-related errors. This file is recreated on each restart of the server. The file will be empty if no errors were encountered. It's maximum size is 5 MB.
NanoAgent.log – contains runtime error and debugging information (you can adjust this logger's settings using the Enable trace logging option in the Observer Communication policy.)
NanoAgentPreprocessTrace.log – contains information about bytecode instrumentation errors and debugging, class-loading, and preprocessing. This file is regenerated on each restart of the server. The maximum size of this log file is 10 MB. Because the JAX-RPC probe is not aspect-based, it does not write to this log.
This file was renamed for release 12.1.0.2.4. For observers of previous releases, the file was named AWTrace.log.
Note:
You can also configure the observer to log observed messages. For information on this topic, refer to the "Log observed messages to file" field in the Observer Communication policy.The default location of the log files is:
-
the JBOSS_HOME/bin directory of a JBoss server
-
the domain directory of a WebLogic server
-
the profile directory of a WebSphere server
-
c:/temp/NanoAgentBaseDir for WCF and ASP.NET
Note:
The default log location for WCF and ASP.NET is not a true default. It is simply the default setting of the AmberPoint:NanoLogBaseDir key. If you set this key to null, log files will not be created.If you want the log files generated in a different directory, set the AP_NANO_LOG_BASEDIR Java property or AmberPoint:NanoLogBaseDir Windows key. For Java application servers, you can set the property to either an absolute path or a path that is relative to the default log directory. For WCF and ASP.NET, you must set the key to an absolute path. The following examples illustrate how to set this property or key:
-
On JBoss, edit your server startup script JBOSS_HOME/bin/run. In the options section of the file, add set JAVA_OPTS=-DAP_NANO_LOG_BASEDIR="my_log_dir". This relative path would generate the log files in the directory JBOSS_HOME/bin/my_log_dir.
-
On WebLogic, if you configure your server by editing local scripts, edit the nanoEnvWeblogic script located in WL_HOME/nanoagent/bin directory. In the options section of the file, add -DAP_NANO_LOG_BASEDIR="my_log_dir" to the end of the NANOAGENT_JAVA_OPTIONS. This relative path would generate the log files in the directory my_log_dir under your domain directory.
If you configure you WebLogic server using the Node Manager, open the WebLogic Administration Console, select your server, and display the Configuration / Server Start tab. Then add -DAP_NANO_LOG_BASEDIR=my_log_dir to the Arguments field. This relative path would generate the log files in the directory my_log_dir under your domain directory.
-
On WebSphere, in the WebSphere Administrative Console, navigate to Servers > Application servers > server1 > Server Infrastructure > Java and Process Management > Process Definition > Java Virtual Machine > Custom Properties (you might have to substitute a different server name for server1). Create a custom property named AP_NANO_LOG_BASEDIR and set it's value to my_log_dir. This relative path would generate the log files in the directory my_log_dir under your profile directory.
-
For WCF or ASP.NET, edit the application configuration file (for example, Web.config) and set the value for the AmberPoint:NanoLogBaseDir key to C:/Inetpub/wwwroot/my_log_dir. This absolute path would generate the log files in the directory my_log_dir under your default web site directory, for example:
<configuration>
 <configSections>
  ...
 </configSections>
 <AmberPoint>
  <NanoAgentDataSection>
   <add key="AmberPoint:NanoConfig" value="c:/temp/NanoAgentLogBaseDir/nanoagentDiscovery.CONFIGURATION"/>
   <add key="AmberPoint:NanoLogBaseDir" value="c:/Inetpub/wwwroot/my_log_dir"/>
   <add key="AmberPoint:NanoCreateLogBaseDir" value="false"/>
  </NanoAgentDataSection>
 </AmberPoint>
 <system.web>
  ...
 </system.web>
</configuration>
In order for the observer to generate the log files, ensure that the user under which the observer is running has permission to write to the log directory. For Java observers, the user is the user that is running the application server. For IIS observers (WCF and ASP.NET), the user is as follows:
-
IIS 5.x – the observer user is ASPNET
-
IIS 6.x and 7.x – the observer user is NETWORK SERVICE
By default, the directory specified by the AP_NANO_LOG_BASEDIR property is automatically created if it does not exist. If you do not want this directory to be automatically created, set the property AP_NANO_CREATE_LOG_BASEDIR to false. In this case, you must create the directory yourself. Set this property in the same way you set AP_NANO_LOG_BASEDIR.
Notes:
For Java application servers – If the log directory does not exist and AP_NANO_CREATE_LOG_BASEDIR is set to false, runtime errors might occur and the observer might not initialize.For IIS – If the NanoAgentLogBaseDir Windows key set to null, log files are not created.